Frugivore and plant genetics
Published:
Scientific communication aimed for Ecology undergraduate students, published on April 2019, as per invitation from Prof. Kim McConkey, in the Frugivore and Seed dispersal (FSD) webpage.
April 1, 2019
Hi everybody, I’m Tiziana, and this month, I’m taking over this month to talk about frugivores and plant genetics.
I did my PhD on frugivore behavior and plant spatial genetics. I focused on tamarins of the Amazon Rainforest in Peru, where I grew up. It was nice to go back to my home country, to figure out that the relationship between frugivore behavior and plant spatial genetics was much more complicated than I thought.
Animal behavior and plant characteristics continually influence each other on a causal loop, making the outcome in terms of plant spatial genetics very case specific.
Join me this month to look into specific cases where the effect of animal behavior on plant spatial genetics has been analyzed, and hopefully by the end of the month we will end up with a general understanding on the different ways in which animals determine plant spatial genetics, what this means and why this is important.
April 3, 2019
Gene flow in plants happens through pollination and seed dispersal. Pollination will determine the intensity of genetic relatedness between individuals of the next generation, and seed dispersal will determine the spatial distribution of these individuals. Of course, in the long run the distribution of individuals influences the probability of pollen flow between individuals, therefore seed dispersal, in the long run, also influences the intensity in genetic relatedness between individuals.
When we want to understand the effects of seed dispersal on plant genetics, we should look into plant spatial genetics. i.e. How are plants genetically related to each other in relationship to their position.
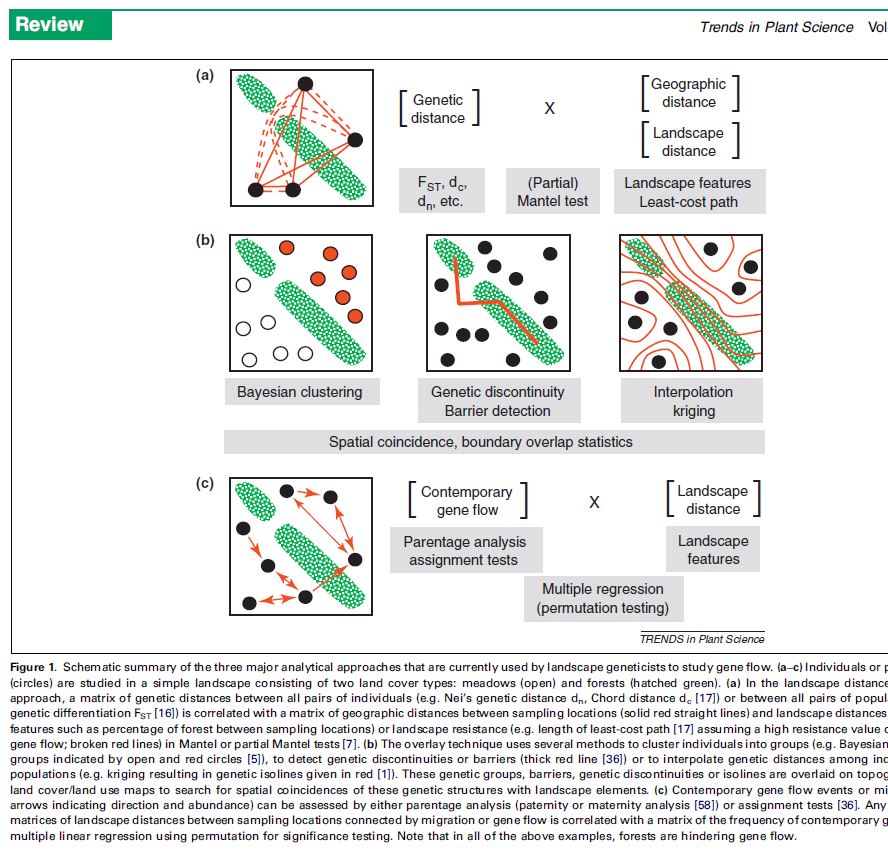
The study of plant spatial genetics is comprised within the subject of landscape genetics, which assesses gene flow at the landscape level. Several approaches may be used for this:
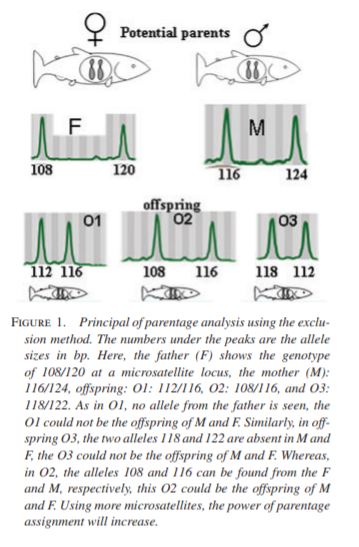
(a) Landscape distance/resistance approach: correlating genetic distance (e.g. Nason’s Fij coefficient) with geographic or landscape distance to identify barriers to gene flow. (b) Overlay approach: clustering individuals into genetic groups (e.g. Bayesian cluster analysis), detecting genetic discontinuities and overlaying these onto maps describing landscape features. (c) Parentage analysis (e.g. with CERVUS) or assignment tests (e.g. GENECLASS) to determine any current relationships between areas sampled. (This method assesses contemporary gene flow rather than historical gene flow)
In the context of frugivores and seed dispersal, we can use these approaches to overlay plant genetic information to animal behavior and animal movement data. We’ll be looking into this in the next posts.
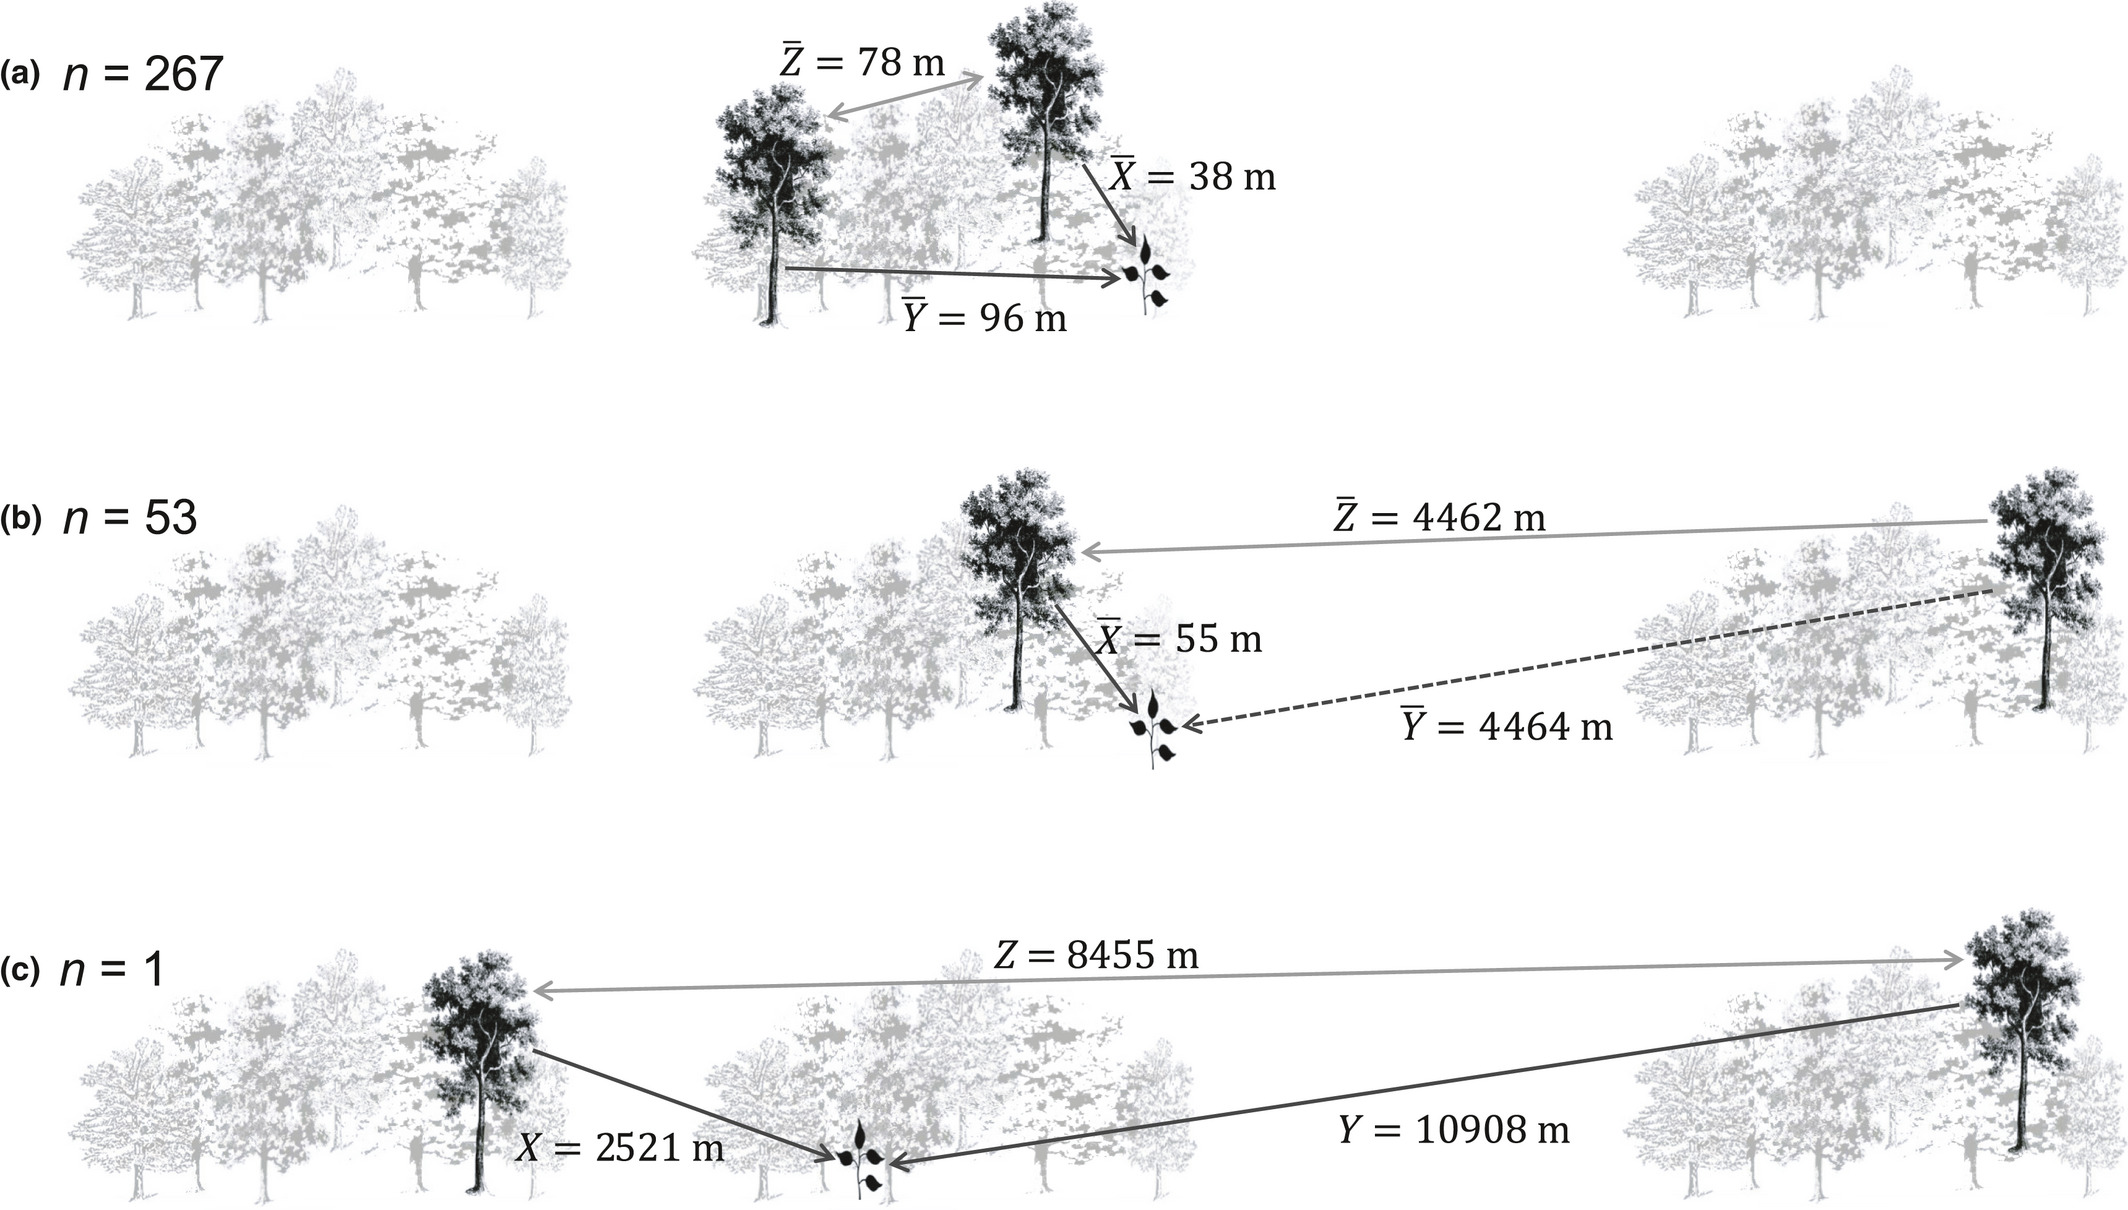
For more on landscape genetics and the figure below, read Holderegger et al, 2010
April 4, 2019
The first method we described in the last post, is the one used to determine the presence of spatial genetic structure.
Spatial genetic structure defines the presence of a non-random distribution of genotypes throughout the population (i.e. individuals that are more genetically related are also spatially closer). The presence and degree of spatial genetic structure within a population can be related to local gene flow restriction and seed dispersal dynamics restricting such gene flow.
Vekemans and Hardy (2004) were the first to put into relationship plant life history traits to spatial genetic structure. They found that wind dispersed plants had a lower intensity of spatial genetic structure than animal dispersed plants. They didn’t really distinguish between animals though.
Hardy et al. (2006) put again into relationship seed dispersal and spatial genetic structure, in 10 plant species, and found scatter-hoarding and gravity dispersed plants had stronger spatial genetic structure than frugivore dispersed plants. They put scatter-hoarding and gravity in the same bag and all frugivores in another bag.
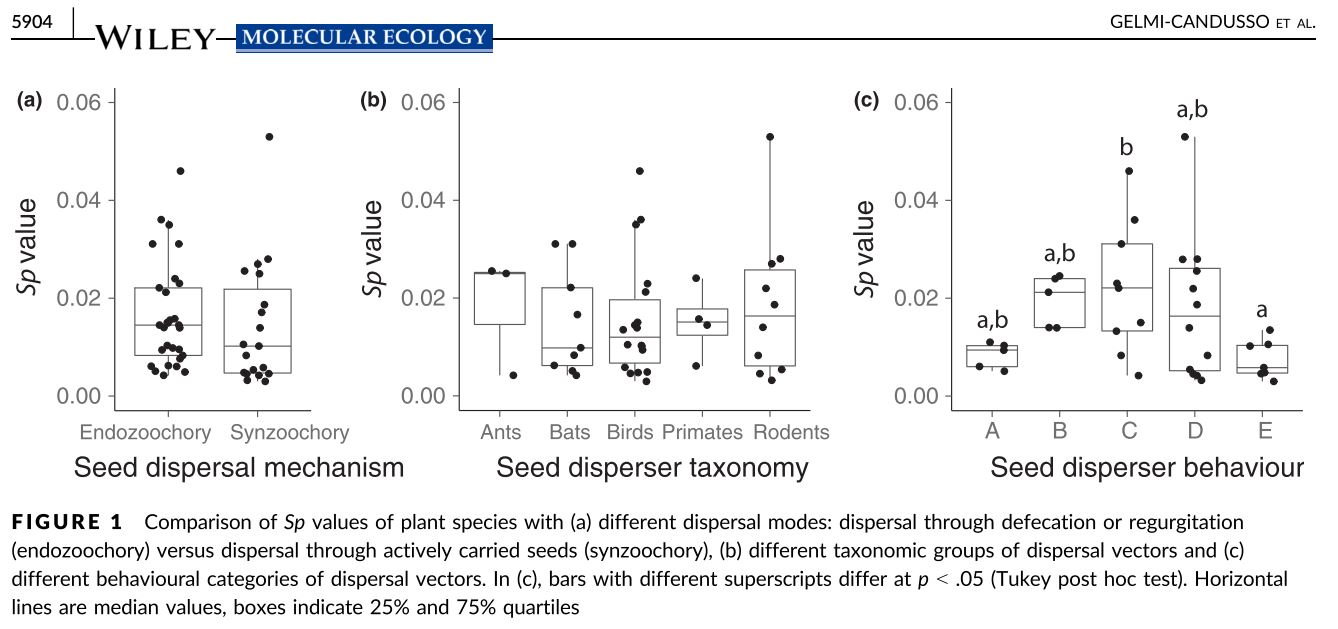
Finally, Gelmi-Candusso et al. (2017) distinguished between plants dispersed by different animal vectors, without the confounding factor of barochory (i.e. gravity) and distinguishing between different animal behavior. The results confirmed endozoochory (i.e. frugivores) was in fact related to weaker spatial genetic structure than synzoochory (e.g. scatter-hoarding animals) (Fig 1(a)).
Most importantly, the results showed that, even though most spatial genetic structure papers describe their plant’s dispersal vector vaguely in terms of taxonomy, disperser taxonomy had little to do with plant spatial genetic structure (Fig 1(b)).
Instead, the results showed that regardless of the taxonomic affiliation of the animal, spatial genetic structure was mostly related to animal foraging behavior. When the animal vector had long feeding bouts or short post-feeding movements (Fig.1(c) B) the plant had stronger spatial genetic structure than when the animal had short feeding bouts or long post-feeding/seed collecting movements (Fig 1(c) A,E).
However, there was still great variation within groups of animals with behavior that led to an accumulation of seeds (i.e. roosting; larder-hoarders) (Fig 1(c) C,D). A potential cause is maternal source diversity of accumulated seed has a stronger effect on adult spatial genetic structure than seed dispersal distance.
We’ll learn more about how specific cases of frugivore behavior that leads to the accumulation of seeds affects spatial genetic structure in the next posts.
April 7, 2019
On the last post, we discussed how spatial genetic structure is highly variable, in terms of intensity, in plants whose seeds have been accumulated by animals.
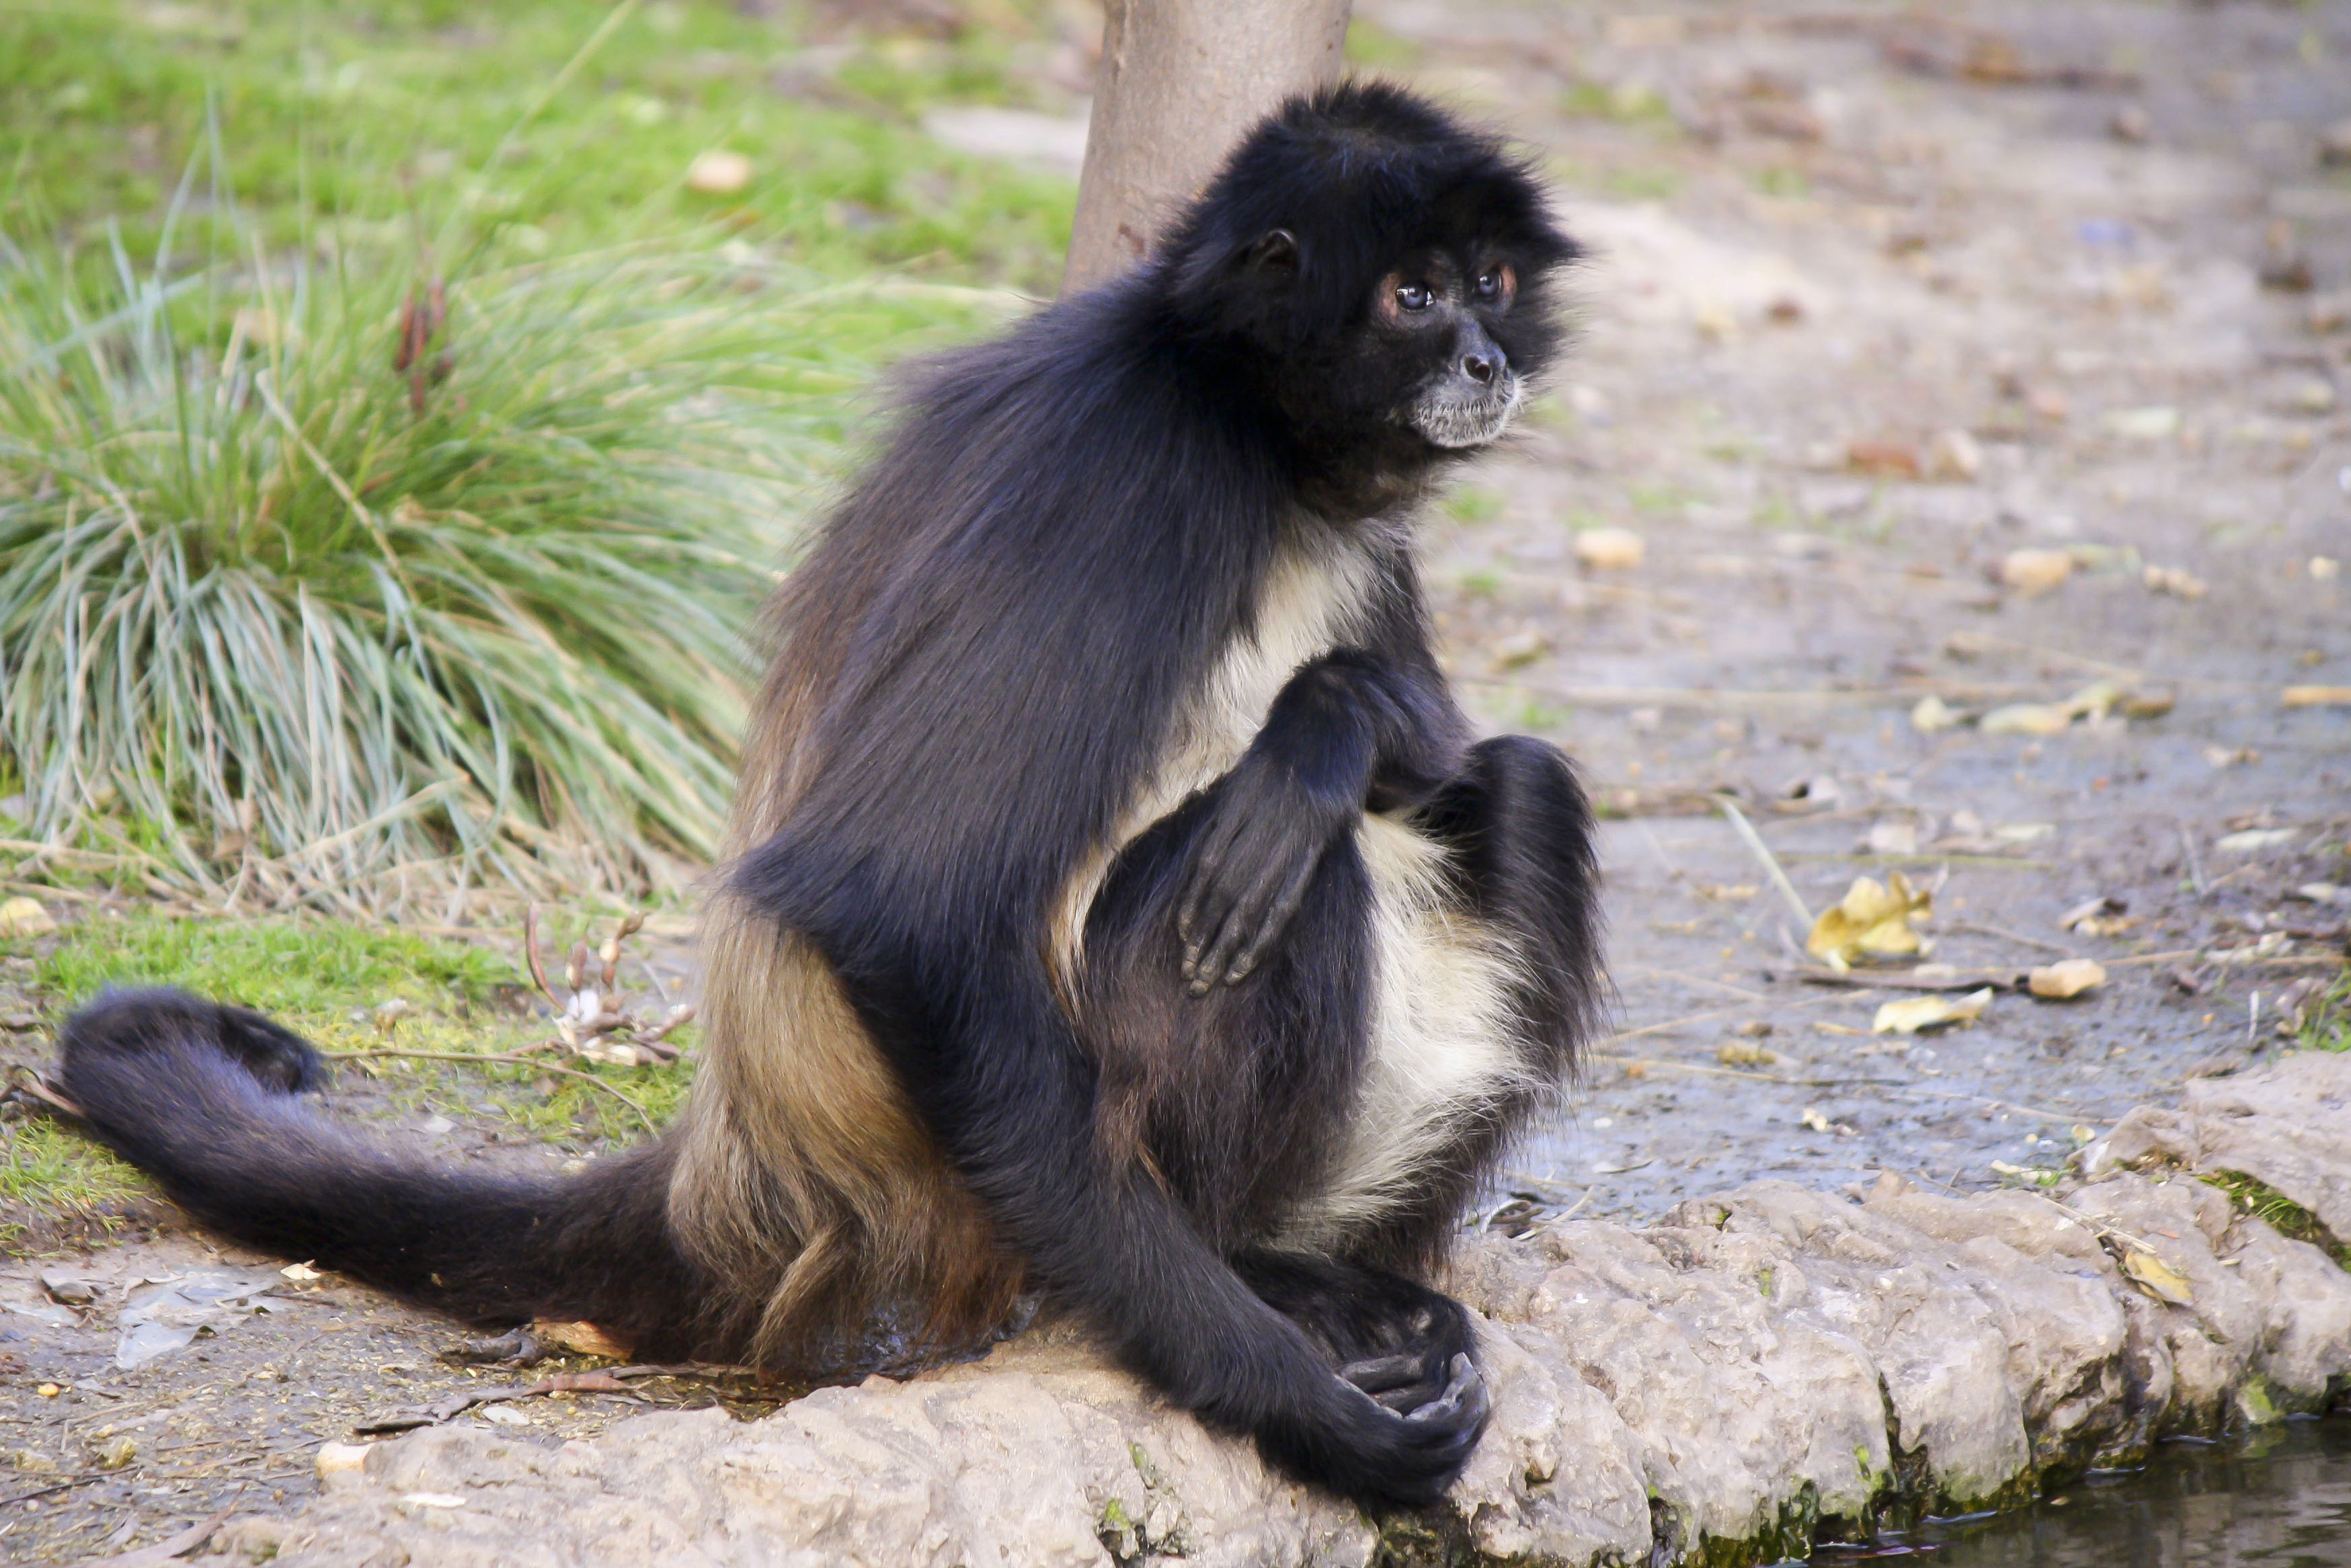
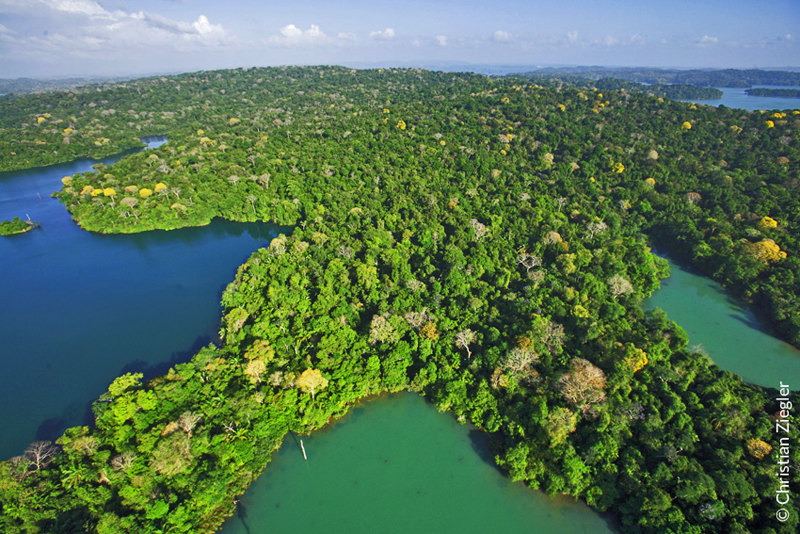
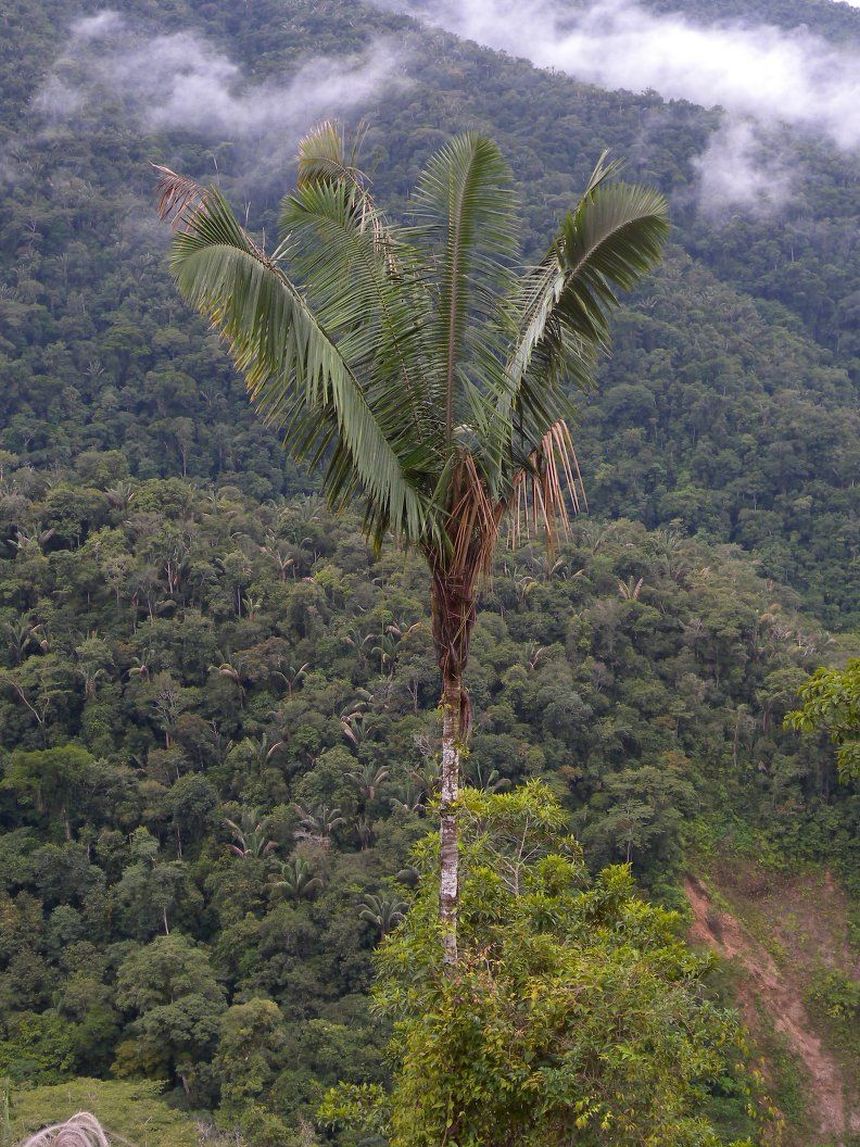
Here we see the example of the spatial genetic structure created by white-bellied Spider Monkeys in a Palm in Barro Colorado Island, Panama
Karubian et al (2015) found strong spatial genetic structure in seeds of Oenocarpus bataua deposited beneath the sleeping sites of white-bellied spider monkeys, which are used repetitively. Within these, a low number of maternal sources was genetically identified.
These results were contrary to their expectations given spider monkeys’ wide range of movements, their fluid social organization and the use of multiple sleeping trees over time, but were attributable to their daily patterns using sleeping trees, their fast gut passage rates and their long feeding bouts. These factors lead to the concentration of a high number of seeds from few maternal sources beneath each sleeping tree, leading to a high rate of genetic relatedness between these seeds.
So we see several factors can lead to a low maternal diversity of accumulated seeds: long feeding bouts, fast passage rate, the use of few fruiting trees before resting.
It’s interesting to note how we can improve our understanding of disperser behavior by analyzing plant spatial genetics. In my opinion, spatial genetics should not be used alone to understand disperser behavior, since there are confounding factors, such as pollination, other seed dispersers, and sometimes even asexual reproduction; but it is a great tool to support inferences we make from animal behavior analysis, concerning the effects of frugivores on plant populations.
Photo: Spider Monkey by Fábio Manfredini – Flickr. Barro Colorado Island from the Smithsonian Institute Webpage si.edu Oenocarpus Batua from Palmpedia.net
April 8, 2019
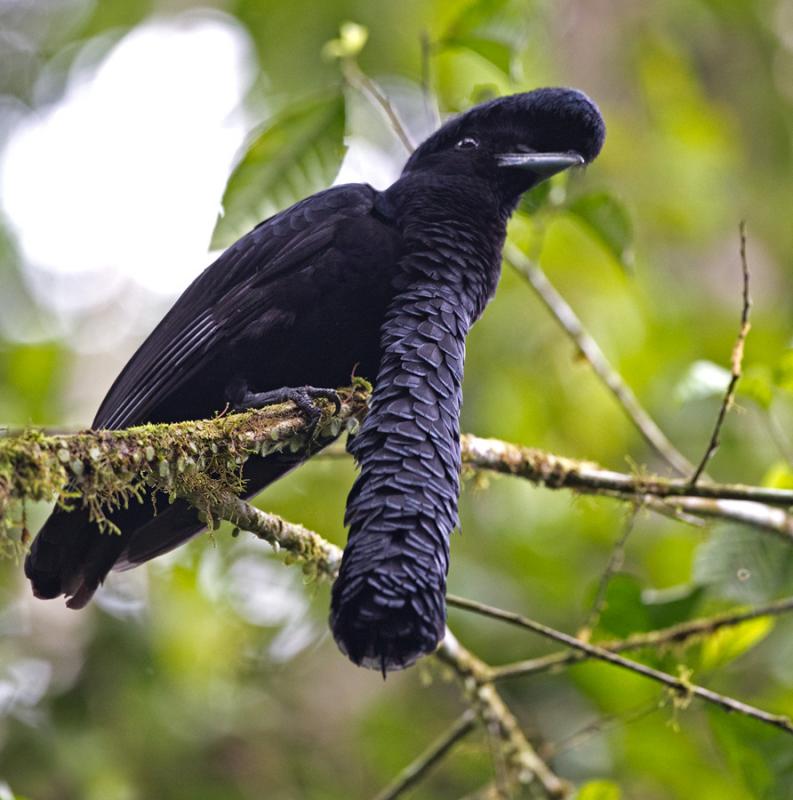
The same Palm tree we saw on the last post can have weaker spatial genetic structure within its seed accumulations when dispersed by male long-wattled umbrella birds (Cephalopterus penduliger) (Karubian 2012). Last month we saw a post on this bird as seed disperser with sex-related individual differences. We will see in this post the effect of its sex-related behavior on the spatial genetic structure within and outside the leks.
Leks are mating related territories, to which male birds always come back after feeding and where most seeds are regurgitated. They spend 80% of their time within these leks and deposit 50% of the seeds. Males constantly come and go to their leks, visiting several fruit trees throughout the day. As a result, the authors found a high number of maternal sources within leks (27 vs 5), and a higher proportion of immigrant coming from outside the study area (44%), increasing genetic diversity and reducing spatial genetic structure within leks.
Other factors that can influence the number of maternal sources within seed accumulations, include the spatial distribution of resources, body size of the dispersers, its social structure and feeding competition.
The number of maternal sources within accumulations of seeds, and their place of origin, can be determined with genetic markers: through parentage analysis of seedlings or through a direct identification of mothers from seed coats.
Spatial genetic structure at the seed stage, and the seedling stage, doesn’t necessarily remain until the reproductive stage. Post dispersal processes will ultimately determine whether spatial genetic structure created through seed dispersal remains over generations.
Links: Karubian et al. 2012. Mating Behavior Drives Seed Dispersal by the Long-wattled Umbrellabird Cephalopterus penduliger For more on methods for analyzing seed dispersal distance here
Photo:Lars Petersson
April 10, 2019
This time we will discuss an example of how changes in habitat conformation can lead to changes in frugivore behavior and plant spatial genetic structure.
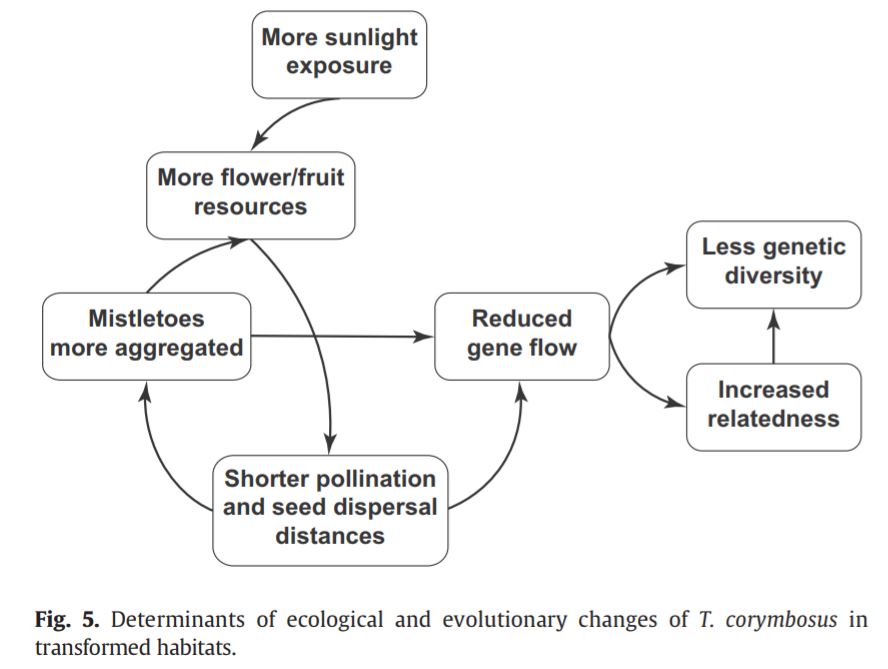
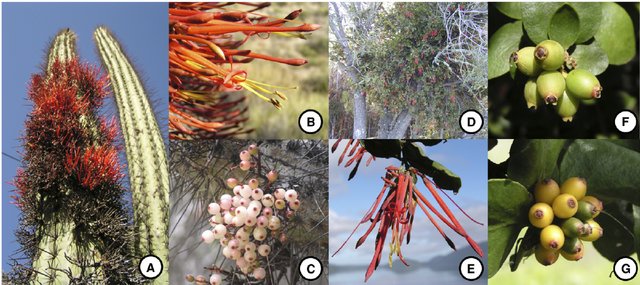
Fontúrbel et al (2018) studied spatial genetic structure in marsupial-dispersed mistletoes in Valdivia (Chile) and compared native habitats versus transformed habitats.
Transformed habitats are habitats where local vegetation has been changed, but not necessarily discontinued as in fragmented habitats, e.g. plantations. This transformation can lead to a series of environmental modifications which cascades into frugivore behavior and plant spatial genetic structure, as was seen by Fontúrbel et al. (2018)
In the study, transformed habitats had a simpler vegetation and a consequent stronger sunlight exposure, which led to the proliferation of many shadow-intolerant species with larger flower displays and fruit crop sizes. This increased fruit availability, changed the dispersers visitation rates, increasing the time spent feeding at the same location 3x in comparison to native habitats. Mistletoes within these habitats had stronger spatial genetic structure and lower genetic diversity than mistletoe populations in native habitats.
The increased time feeding and foraging at the same location increases the number of fruits consumed from each plant individual and reduces the distance between seeds dispersed of this individual, leading to increased genetic relatedness between closely distributed plants. Together with short pollination distances, this likely results in lower genetic diversity within the population, with long term evolutionary implications.
link to paper: https://www.sciencedirect.com/…/artic…/pii/S0048969718340063
disperser: “Monito del monte” Dromiciops gliroides Photo by Cristian Benaprés (https://www.flickr.com/photos/cbenapres/)
plant: Mistletoe Tristerix Corymbosus Photo by Amico and Nickrent (2009)
April 13, 2019
The second method mentioned in the first post, the overlay method, helps us understand genetic discontinuities between populations in relationship to the landscape. In this post we give an example on how this can be used to understand seed dispersal.
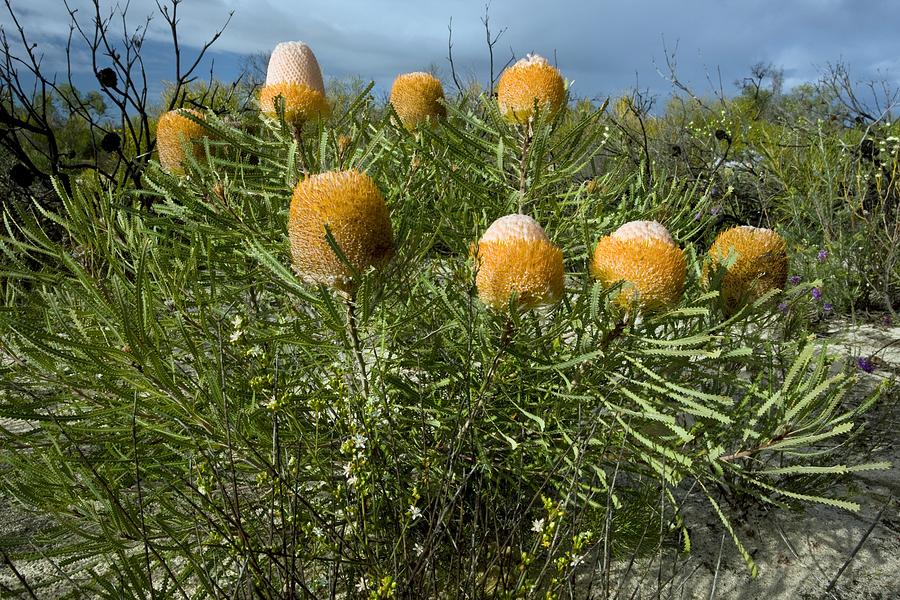
He et al (2010) analyzed the genetic discontinuities in Banksia hookeriana (Proteaceae). Banksia is a fire-killed shrub restricted to isolated sand dunes in south-west Australia generally dispersed by wind for short distances (mostly 10 m).
They analyzed the spatial genetics of individuals from 40 isolated dunes using geneland. The results gave 17 genetic groups within these 40 dunes: 13 genetic groups were a mix of different individuals from dunes, and 4 were groups contianing individuals from two adjacent dunes.
The landscape genetic structure did not match the landscape structure
To understand the genetic connectivity between these dunes, they used Population likelihood assignment tests to infer the seed source population of each individual. They found 5.5% was assigned to a population from a dune outside of their own.
Such strong genetic connectivity, despite the geographical isolation of the metapopulations and short distance seed dispersal, could be explained by wet periods allowing the growth of individuals in areas in-between dune. Since fires happen around every 13 years, time would be enough to maintain inter-generational genetic connectivity.
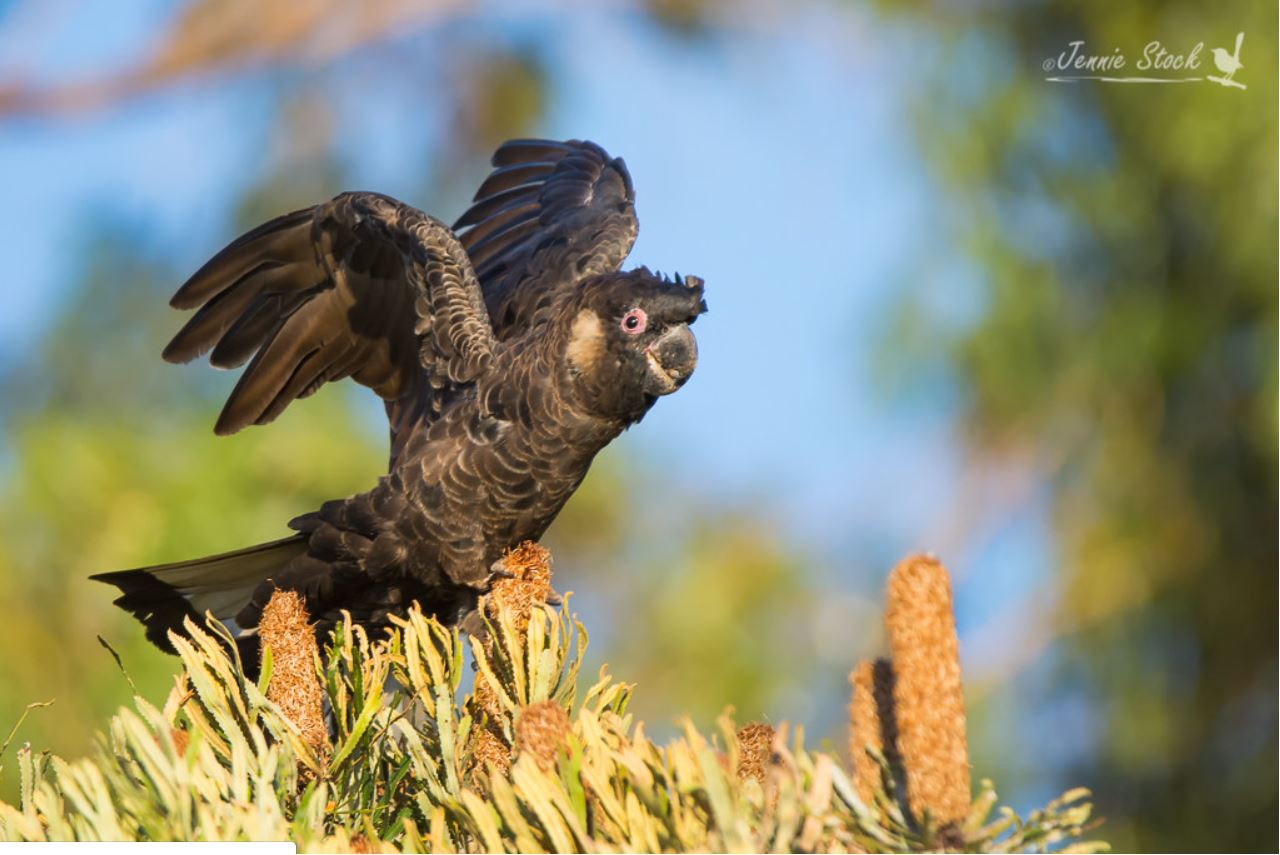
However, some individuals were assigned up to 2.6 km from the parent population. These long distance assignments could be explained by the presence of cockatoos in the area.
Flocks of Carnaby’s black cockatoos (Calyptorhynchus latirostris) seek out banksias after fires to feed on the seeds that are made more readily accessible by the fire-triggered rupture of the protective woody follicles and removal of camouflaging foliage. Cockatoos often remove the cones and fly away to perch sites elsewhere, sometimes dropping the cones in flight or otherwise at the sites of seed consumption.
This example shows how landscape genetics can also reveal the importance of alternative seed dispersal systems that might seem irrelevant to the naked eye.
April 14, 2019
When it comes to seed dispersal, one of the most important things plant genetics can tell us, is that things are not always what they seem. A good method to understand if what we see is true is the third method of our post on landscape genetics: Parentage analysis
Parentage analysis uses a series of microsatellites or other genetic markers to understand the location of an offspring’s source. This is easy in dioecious plants where we know which parent is the mother, and a bit more ambiguous in monoecious plants where an adult could be either pollen or seed source. In this case, chloroplastic markers are ideal.
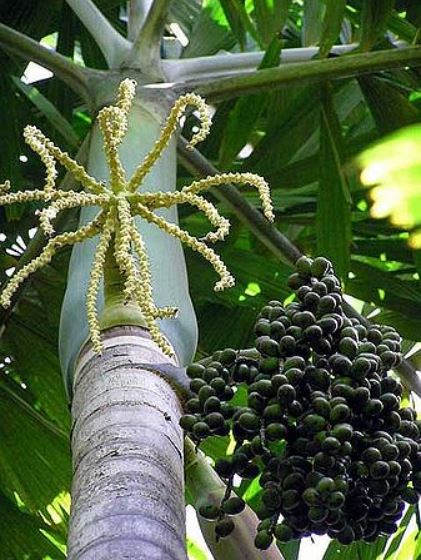
A great paper showing the use of parentage analysis unraveling an alternative reality for what we think we are seeing is Sezen, Chazdon & Holsinger (2009) Proximity is not a proxy for parentage in an animal-dispersed Neotropical canopy palm.
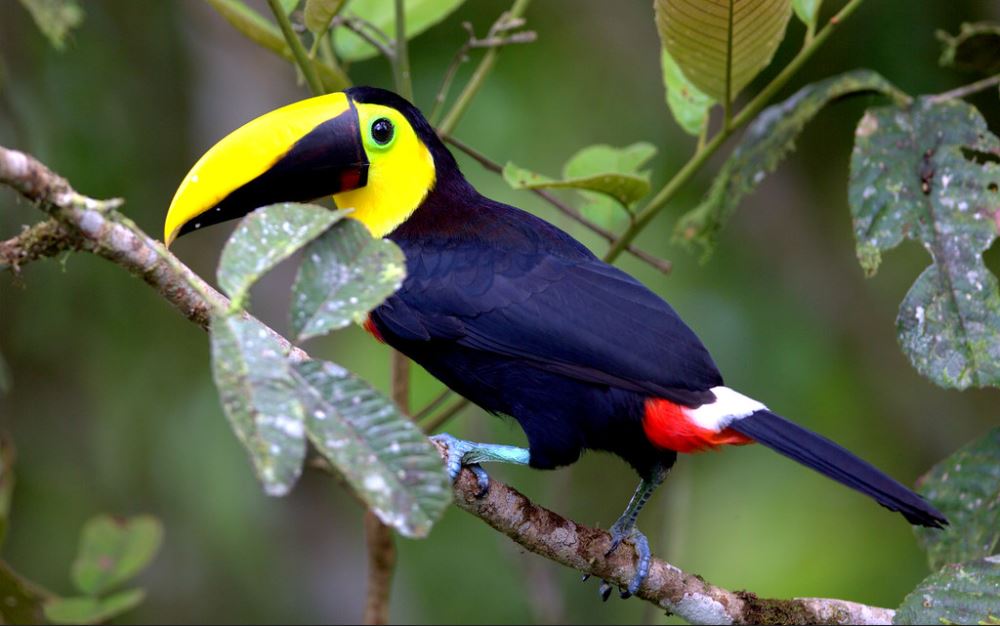
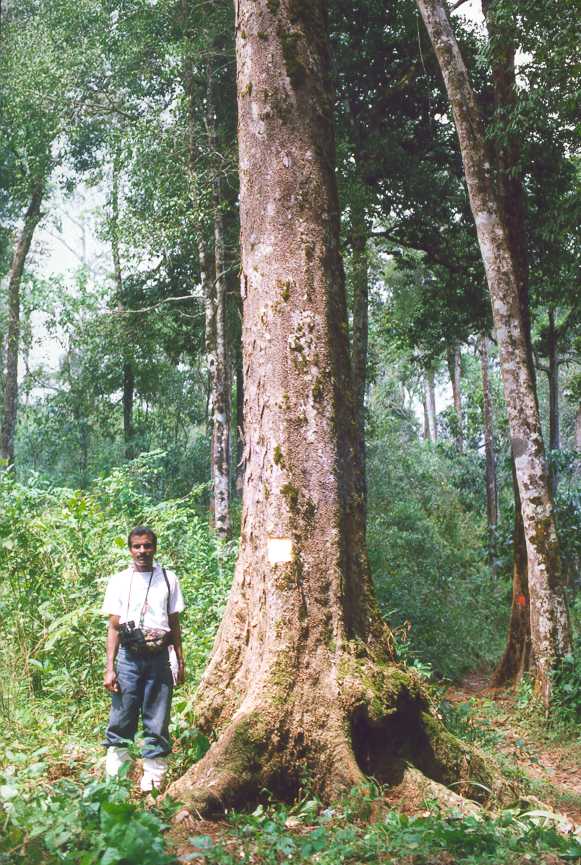
Toucans are the dominant seed dispersers of Iriartea deltoidea in the study area. Toucans swallow entire fruits and regurgitate intact seeds, they fly long distances but have an average gut retention time of 30 min.
It is usually reasonable to believe that the seedlings growing aggregated below fruiting trees belong to the fruiting trees themselves.
However, when the authors examined the genetic composition of seedlings surrounding reproductive trees, only a few seedlings belonged to the reproductive tree of the area where they were growing. For example, in one sampling plot, 64 seedlings had 27 genetic parents, from which only one seedling belonged to one of the eight reproductive trees found in the sampling plot.
Although seedling patches growing beneath fruiting trees had multiple seed sources, 45–88% of the seedlings were either full- or half-siblings. This indicates dispersers may be repeatedly carrying multiple batches of seeds from the same source trees to the same deposition sites.
Between 160 and 240 reproductive trees occur within the home range of a single toucan (<86ha). These trees have asynchronous fruiting throughout the year, and are the predominant fruiting tree in the sampling area (secondary forest), explaining the high genetic relationship between seedlings dispersed together
The results of this study shows:
1) When considering seedlings growing beneath fruiting sources as undispersed seeds, the numbers might be over-estimated. Important for modelling methods, especially in vertebrate-dispersed trees. In these cases parentage analysis is necessary to distinguish dispersal limitation.
2) Successful dispersal away from parental trees does not necessarily enable escape from high densities of conspecific seedlings or adults, as predicted by the Janzen–Connell hypothesis.
3) Spatial distribution of Iriartea deltoidea seedlings is linked to previously described spatial genetic structure; but not because of seed dispersal limitation but because of seed dispersal patterns by frugivores. Despite the long-distance dispersal mechanism usually associated with random distribution of seeds.
This study is an example of how parentage analysis of plants can help us further understand frugivore behavior and their seed dispersal patterns.
Souce Link: Photo source: Tony Dawe, Andy Morffew, Christian Defferrard and Trinidad Bob.
April 17, 2019
Remember how we said it gets ambiguous using parentage analysis when adults can be both seed and pollen source? (Monoecious). Well, Smouse, Sork, Scofield and Grivet (2012) propose a method to make this important analysis more reliable in such cases.
They combine the genetic analysis of seedlings and seeds (pericarp) using nuclear microsatellite markers.
In many cases seedlings usually keep the seed attached for a determined amount of time. The seed coat is maternal tissue, so genotyping it can lead to a direct genetic match with the mother. However, this tissue on seeds attached to seedlings is usually degraded and genotyping it doesn’t yield good results. The condition gets even worse with reduced soil moisture and seeds with longer periods of exposure.
Nonetheless, this decayed tissue and the few genetic results that it may yield, can be used to improve maternal assignment of seedlings.
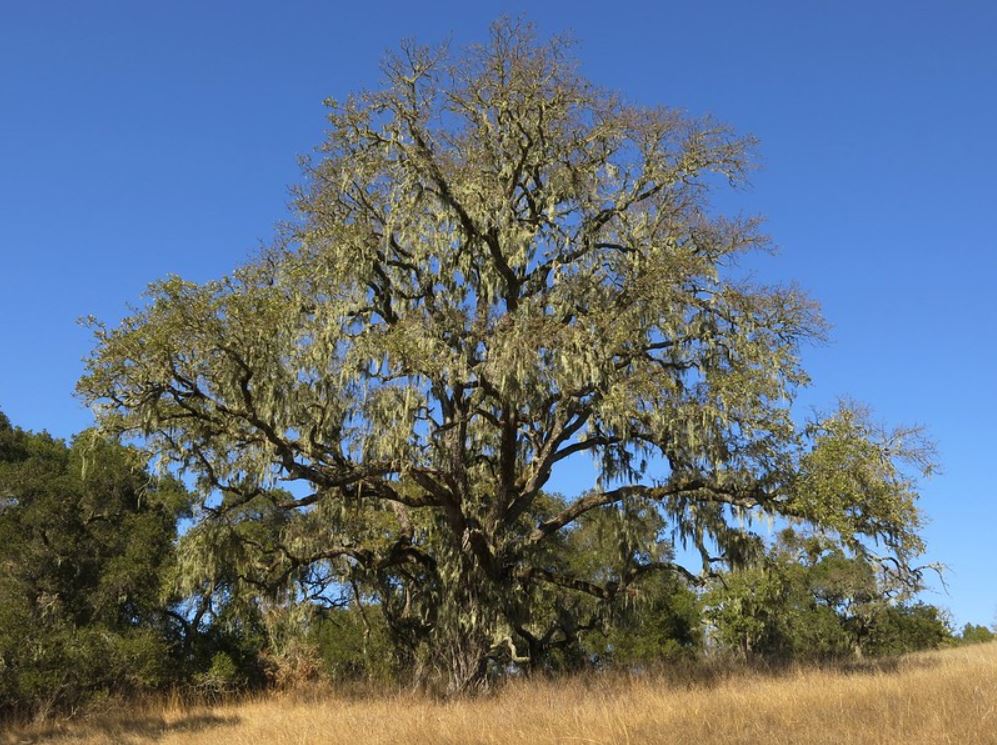
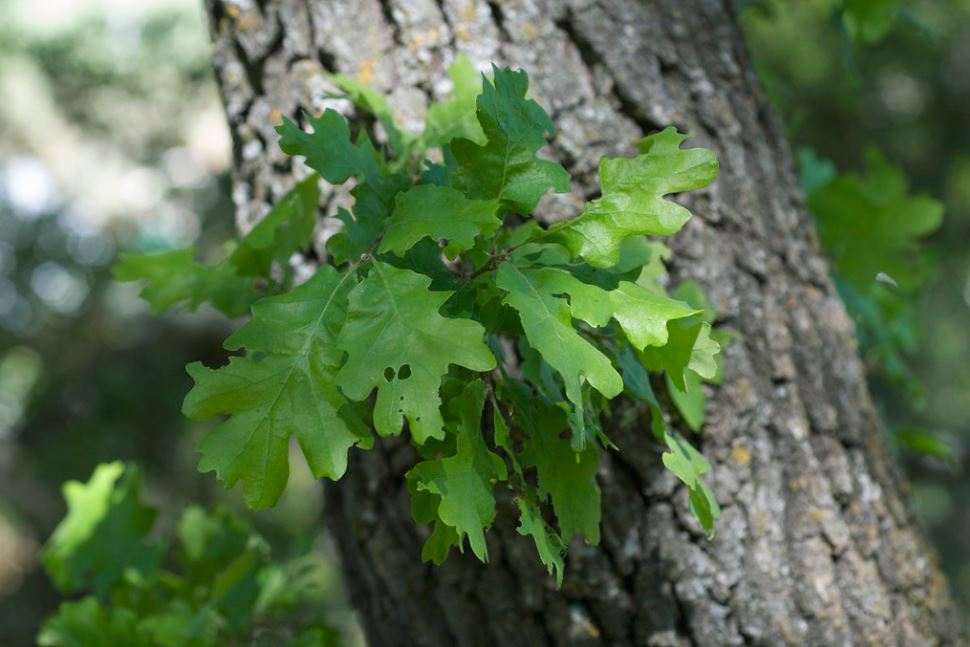
Smouse et al tested the method on Quercus lobate at the Figueroa Creek valley of Sedgwick Reserve, California, and found that, with every seed coat locus added, the maternal assignation of seedlings increased exponential. With only 3-4 seed coat loci added, the maternal assignation of seedlings reached almost 100% of unambiguity.
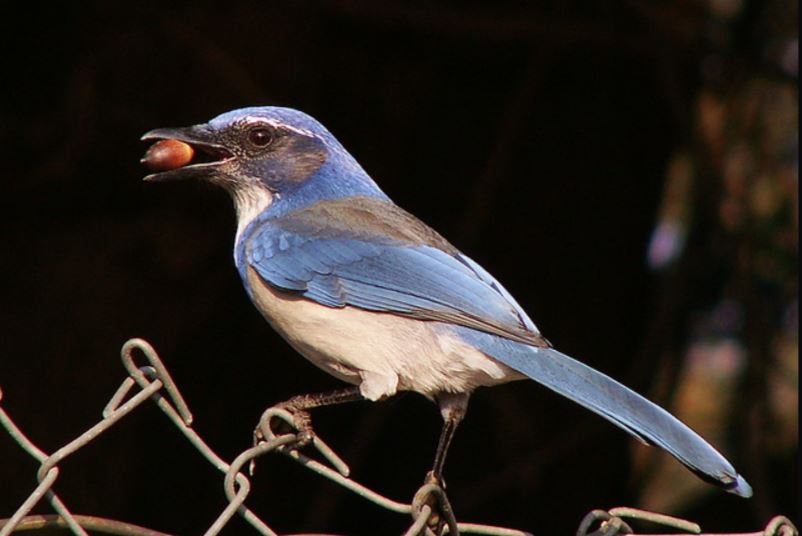
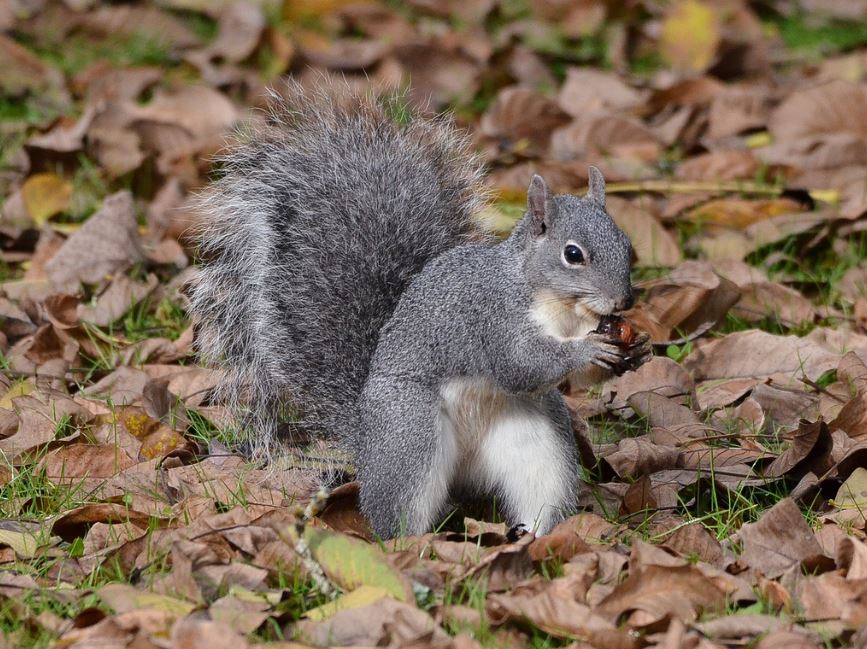
They tested seedlings fallen under canopies (gravity), and in open habitat, potentially dispersed by western scrub jays (Aphelocoma californica), western gray squirrels (Sciurus griseus) and small rodents, such as the white-footed mouse (Peromyscus fasciculata).
From the seedlings under canopies (theoretically obviously attributed to the canopy), using only seedling genetic analysis, they got maternal assignment through parentage analysis only for 55.7%. Adding the pericarp analysis to the equation, they increased the maternal assignation to 94%.
Side note: in this study too, parentage analysis revealed not all seedlings found under the canopy belonged to the canopy, “probably due to some secondary animal-vectored movement of acorns between neighboring canopy patches”.
For seedlings in open habitats, where the seed tissue was decayed the most, they went from 50% of maternal assignation using only seedling genetic analysis, to 91% of maternal assignation including pericarp analysis.
So basically, when sampling seedlings, one should take the whole seedling out, and at the base of the root system, where the seed still lays, detach the seed coat and genotype that too, using the same genetic markers and analytical protocol used for the seedlings. Then after the parentage analysis has been ran for all the seedlings, following their methodological description, we would use the pericarp genotype to assign a maternal source to the seedlings with ambiguous maternal assignment by discarding maternal sources assigned by the parentage analysis that do not perfectly match the pericarp genotype. If the list is not reduced to 2 parental candidates, we can allocate maternity based on relative likelihood values.
Extended use for this method:
Use of unilaterally inherited markers (e.g. chloroplast markers) instead of pericarp tissue
Determine pollen source, by using the combination to discard maternal assignments and infer paternal assignments.
Link paper: Photo source: Alice cummings, Eric Hunt, Oranjepiet, Mikeallred and Don Loarie (Flickr)
April 19, 2019
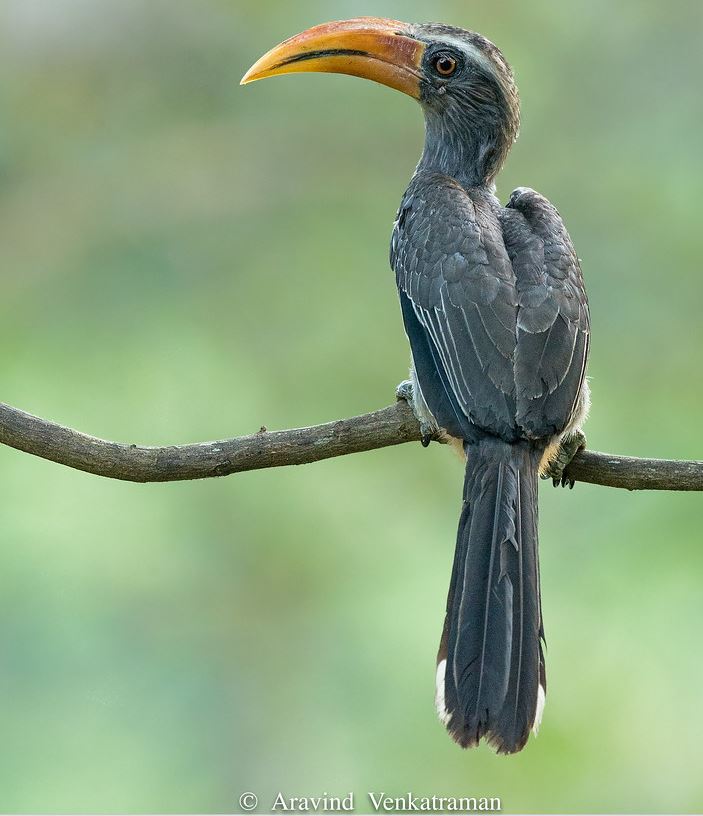
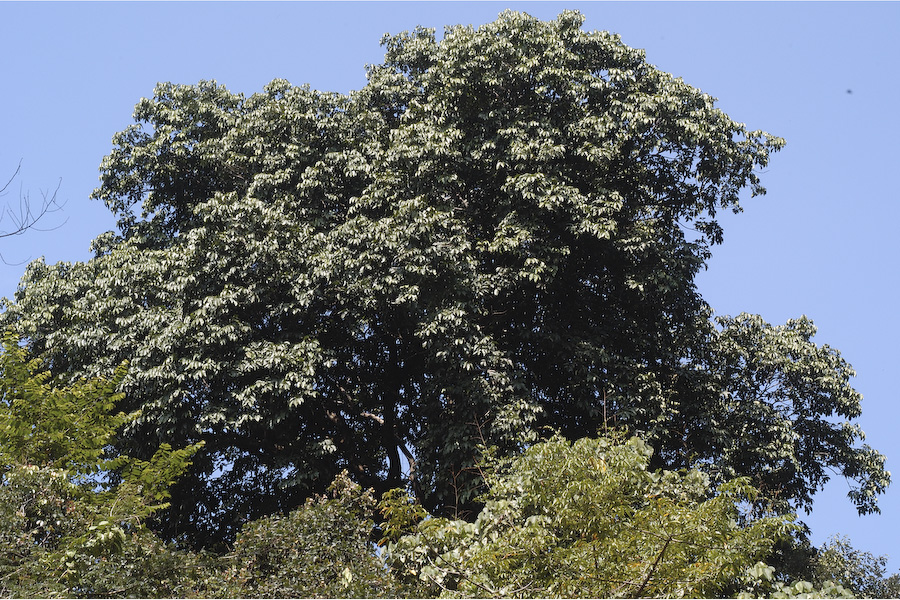
Parentage analysis can be used to assess seed dispersal in fragmented environments. Ismail et al. (2017) used it to understand whether effective seed dispersal of white cedars (Dysoxylum malabaricum) by a large frugivore (Malabar grey hornbill: Ocyceros griseus) is long enough to connect small remnant forest patches within an agricultural matrix. These small forest patches are managed and conserved by local communities for worshiping and are called sacred groves.
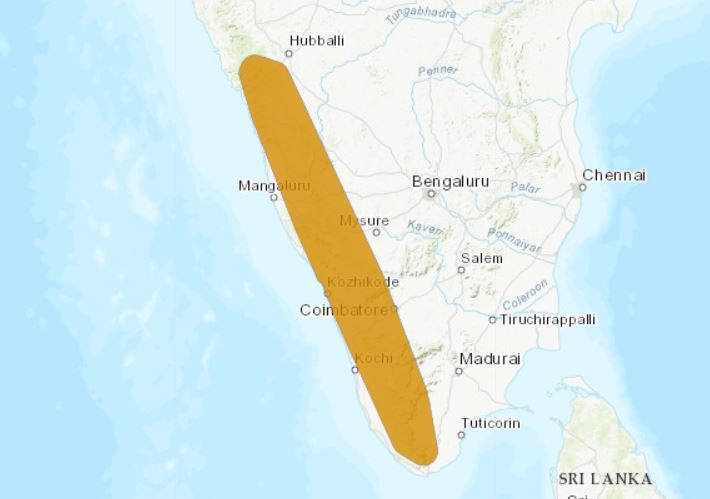
During their exhaustive sampling of 216 km2 they found no White Cedar trees growing outside of these sacred groves. In fact, White cedars are listed by the IUCN as endangered given its limited distribution range (only present along the coast of South Western India).
Ismail and colleagues analyzed microsatellite markers, assigned parents using CERVUS and calculated the Euclidean distance between mothers, fathers and seedlings. They assigned the closest source as seed source by rejecting the hypothesis that hornbills disperse seeds from the maternal tree directly to the pollen source, through a regression analysis.
The Malabar grey hornbill is known as a relatively strong flier crossing over varied matrices between forest fragments. However they found 99.7% of seed dispersal cases were within-patches, from which 95% within 200m.
The results suggest either feeding and regurgitating by hornbills happens only within the forest patches (Regurgitation times are ca. 10 minutes for white cedar seeds), or that the seeds regurgitated outside forest patches are suppressed due to regular weeding of surrounding plantations.
Nonetheless, the study shows immigration of seeds in patches to be 0.3%, and patches have an average distance of 880m between each other, ranging between 400m and 24.5km, showing that seed dispersal by hornbills might be far shorter than previously predicted through observations.
This difference with previous observations might be because previous studies were done during the breeding season. During the breeding season, male hornbills forage for long distances to feed the females in the nests. Instead, fruiting season of white cedars happens after the juvenile hornbills learn to fly (i.e. fledging). Fledging in other birds has been seen to restrict foraging patterns to dense vegetation. In this case, hornbills would remain within the dense vegetation of the sacred groves, limiting seed dispersal within patches.
Side note: Differences in seed dispersal distances in relationship to behavior changes throughout the year are an interesting point for future research.
Through parentage analysis, the study demonstrates hornbills are not effectively dispersing between patches and this has great implications in terms of conservation for the endangered white cedar.
The lack of recolonization might be further hindered by reduced forest patch attractiveness to hornbills in the absence of fruiting white cedar trees.
White cedars live between 35 to 45 years, so the estimated rare events of inter-patch seed dispersal might contribute to the persistence of the white cedar population. However, 0.3% of inter patch dispersal is likely insufficient to maintain resilient populations without management intervention.
This study is a perfect example of how plant genetics can help determine the effective seed dispersal by a frugivore, which is ultimately what is needed for defining conservation measures.
Photo sources: Aravind Venkatramar, Pierre Grard, IUCN, Mike Charkow, Sasch Ismail.
April 21, 2019
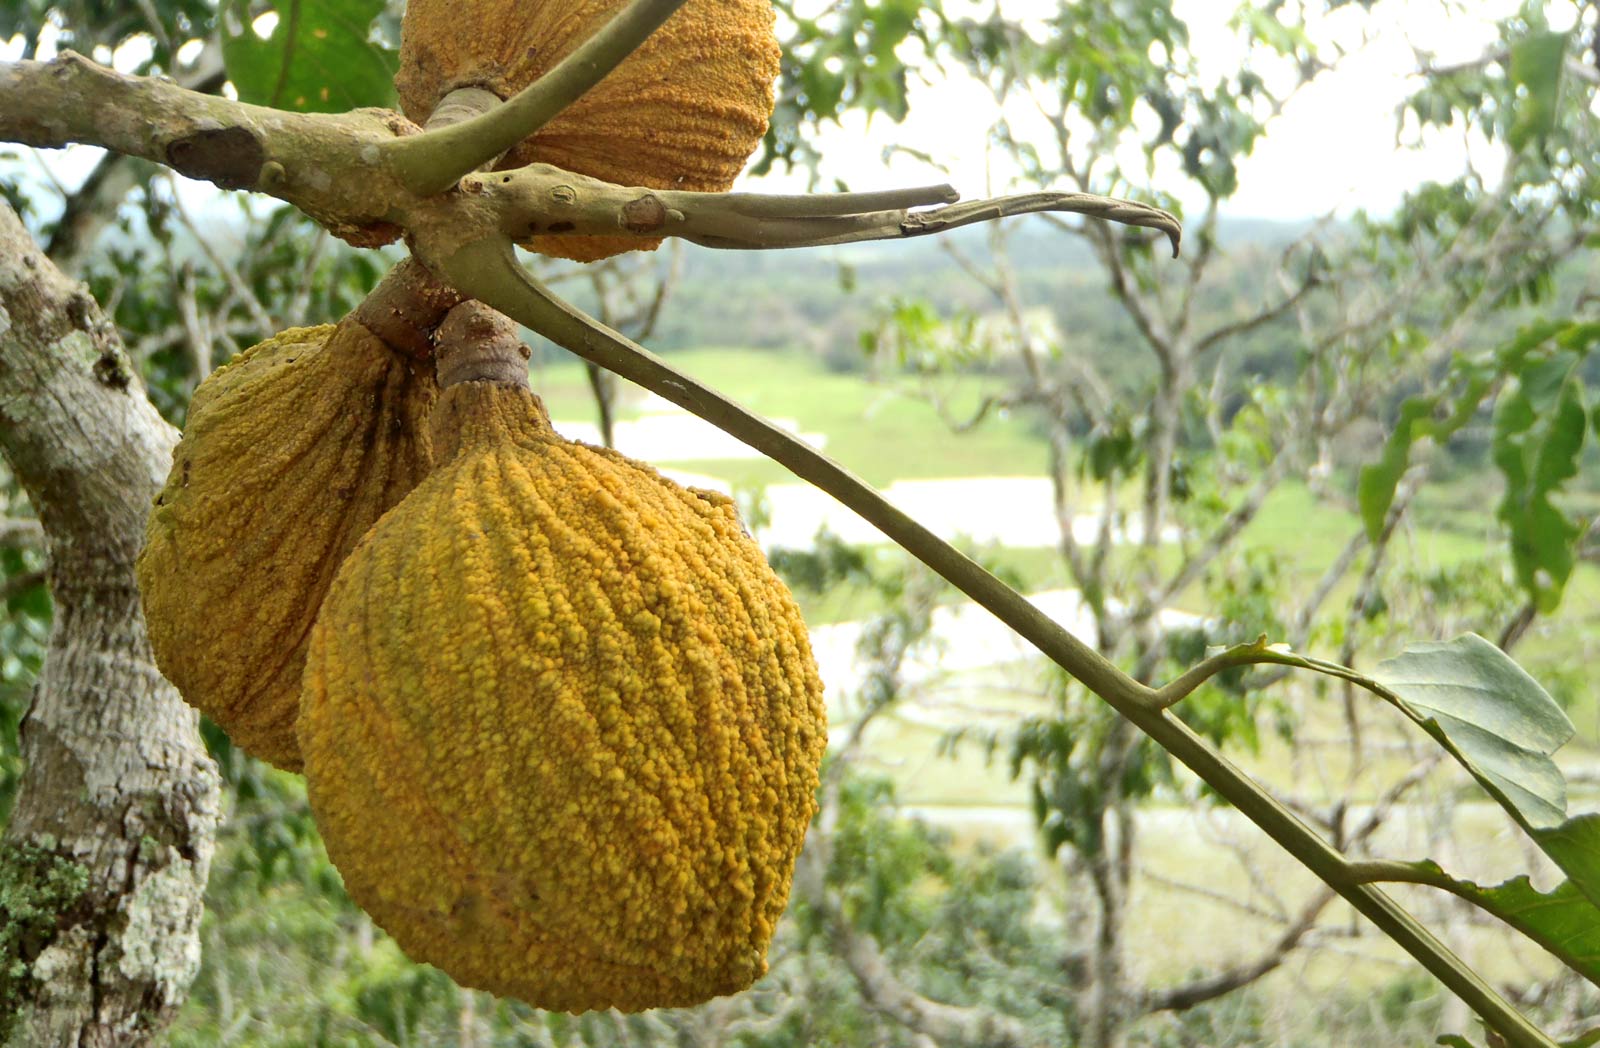
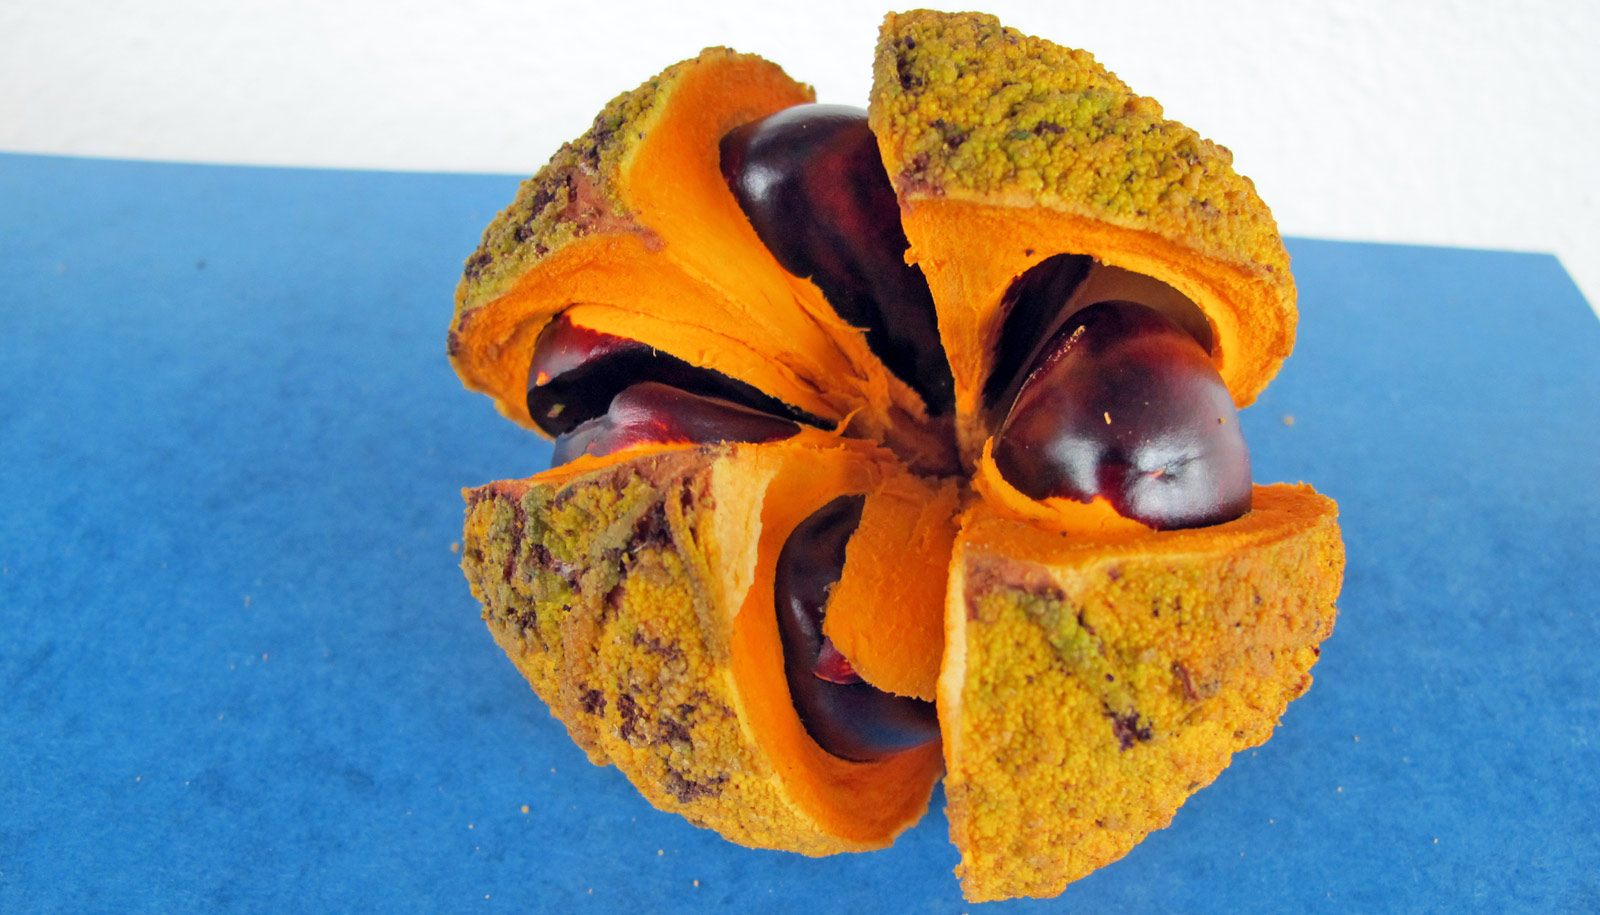
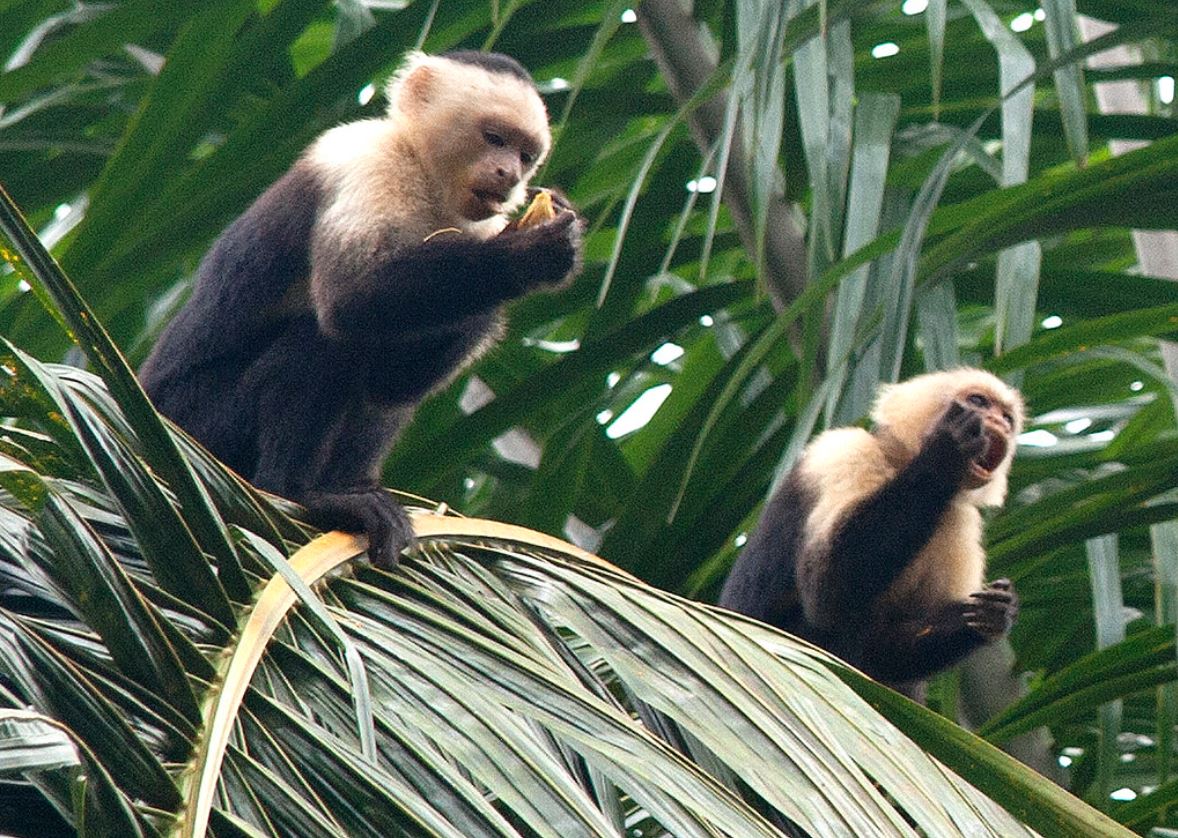
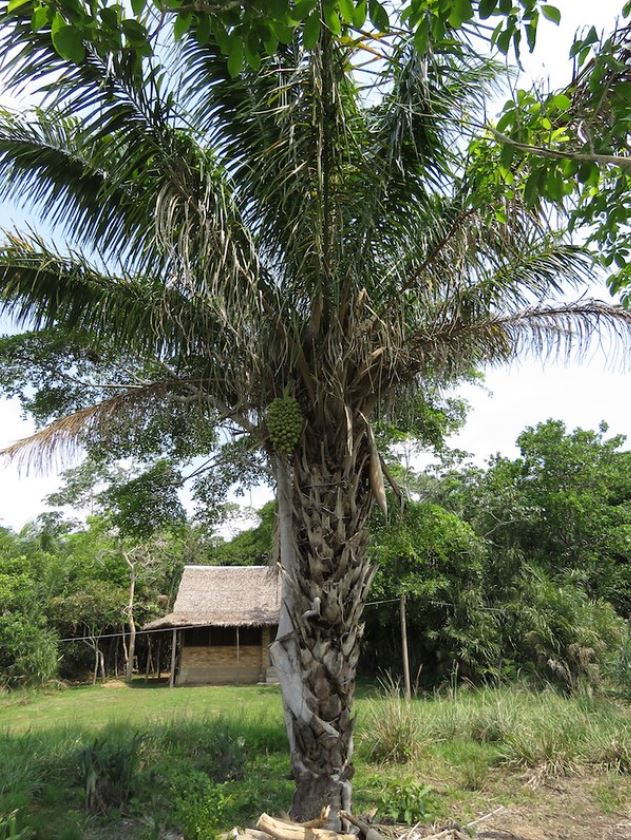
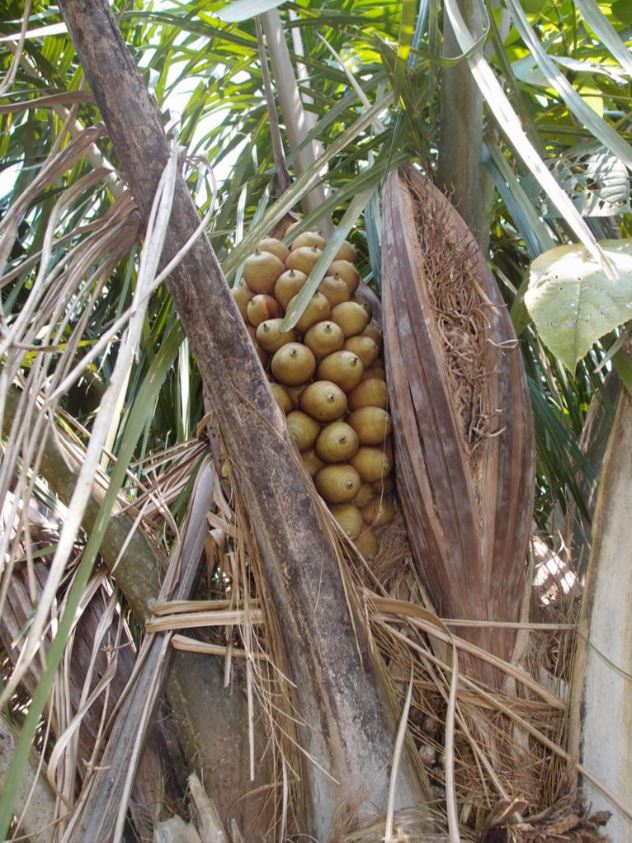
Another example of parentage analysis used to understand seed dispersal by frugivores was done by Choo, Juenger and Simpson (2012) in the Manu National Park, Peru on Attalea phalerata.
Attalea phalerata is monoecious, but the staminate and pistillate inflorescence on individual palms flower asynchronously so the species is considered functionally dioecious. Pollinated by insects and dispersed primarily by capuchins.
Using CERVUS, they found 73% of offspring where mother were identified were dispersed 30m from the fruiting source. Mean seed dispersal distance was 20.5m. From seeds dispersed beneath fruiting sources 58.5% were maternal siblings. The proportion of neighbour siblings decreased over life stages, likely reflecting density-dependent mortality processes.
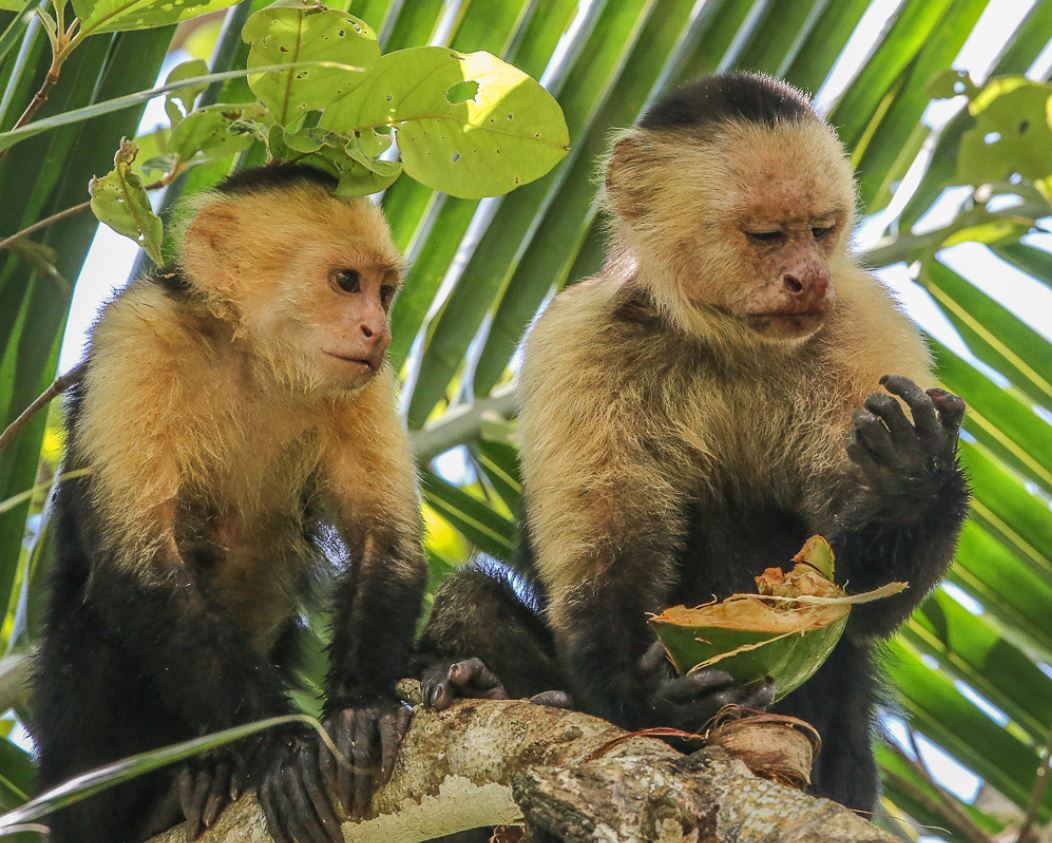
The seed dispersal kernels they found reflects the feeding behavior of Capuchins. Capuchins cause a great number of intact fruits to fall to the ground beneath the fruiting sources. Most seeds from the fruits they actually feed on are also discarded beneath fruiting palms, on branches adjacent to palm crowns, before leaving to other fruit sources.
Seeds of Attalea phalerata that are not dispersed away from under parent palms suffer high mortality rates (c. 80%) from subsequent predation by bruchid beetles. The study also analyses spatial genetic structure through the different life stages and found that this seed dispersal pattern created spatial genetic structure that persisted into adulthood.
Photo credit: Canon Foder (Flickr), Rich Hoyer, Christian Defferrard
April 23, 2019
We can also use plant genetics to differentiate how each frugivore from the dispersal guild contributes to the seed shadow of a plant.
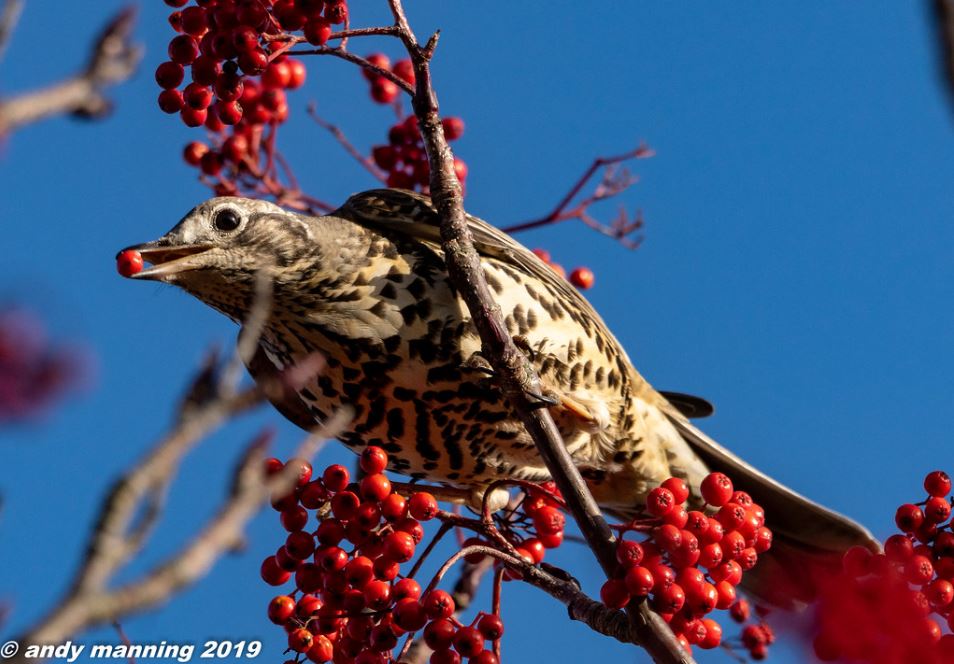
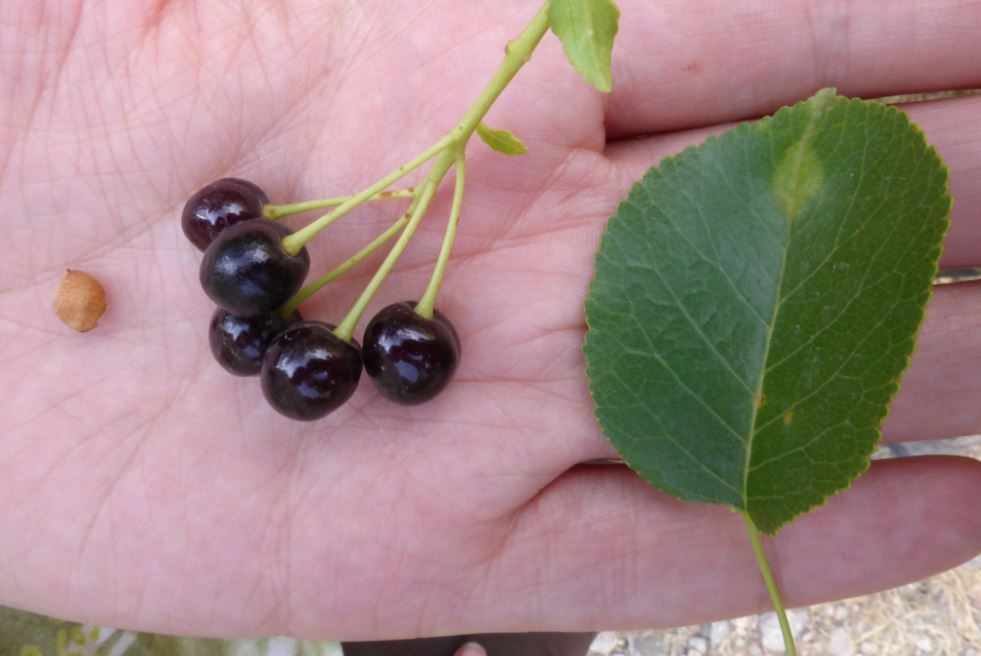
Jordano et al (2007) combined direct observations of fruit consumption, sampling of seed rain by setting seed traps and feces, and linked dispersed seeds to source trees by genotyping seed coats and fruiting trees of Prunus mahaleb.
They identified two components on the seed dispersal kernel. A short-distance component lead by small-sized birds, and a long-distance component lead by medium-sized birds and carnivorous mammals.
In detail, they found: 1) small-sized birds (<110 g) were by far the major seed dispersers of seeds moved <250 m, but rarely dispersed over 100m, while medium-sized birds mostly dispersed over 100m. 2) Larger frugivores (110–500 g) were the major dispersers of seeds moved between 250–990 m. From which carnivorous mammals dispersed seeds between 0 m (i.e., under the canopy of the source tree) to 990 m, with a peak at 650–700 m.
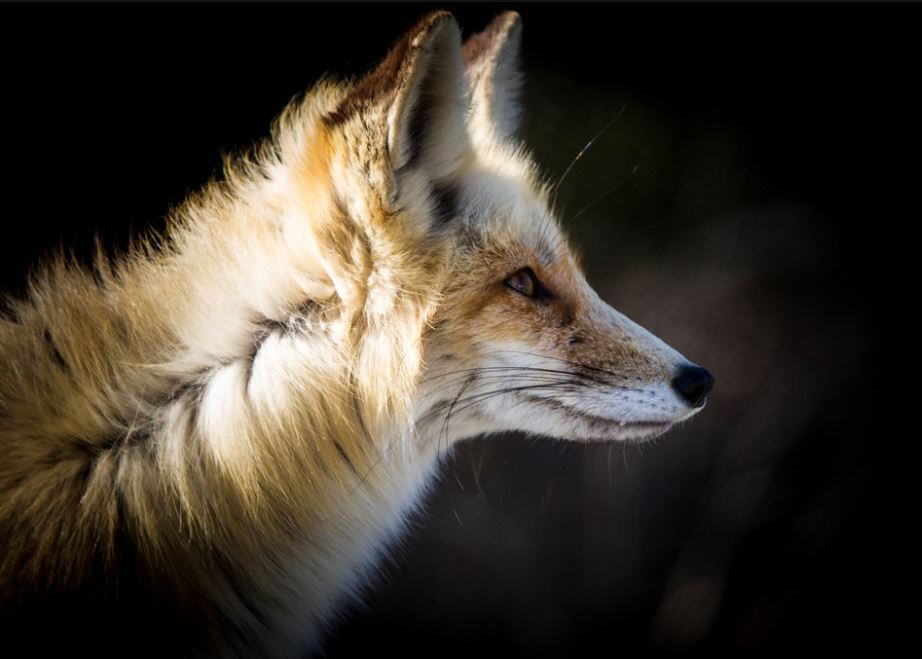
In terms of dispersal distance their most important discovery was that seed immigration from other populations of Prunus mahaleb was mainly through carnivorous mammals (V. vulpes, M. foina, M. meles). Showing critical long-distance dispersal events might rely on a small subset of large species with lower fruit removal rates.
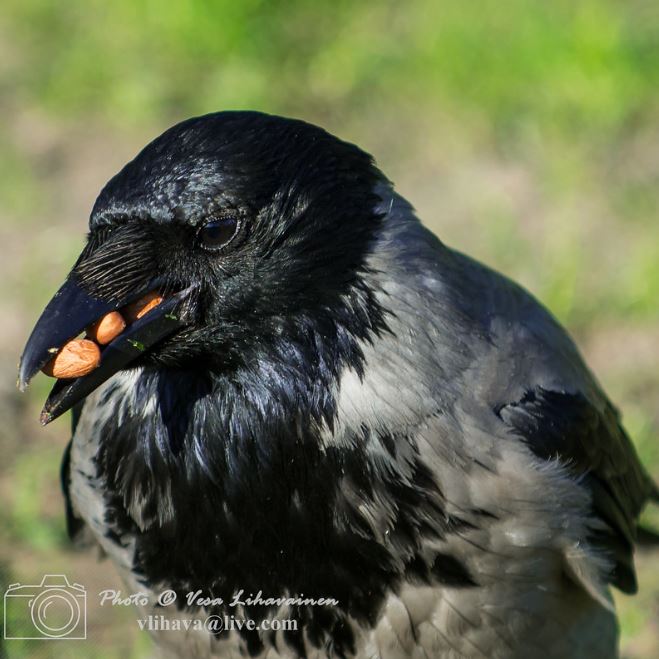
In addition, they found the frequency of seed deposition in different microhabitats differed among frugivores: 1) small-sized birds dispersed seeds mainly beneath the canopies of P. mahaleb and other fleshy-fruited trees or shrubs, where seeds are more likely to establish. 2) Medium-sized birds dispersed seeds mainly to open areas (C. corone) and beneath pine trees (T. viscivorus). 3) Mammals deposited seeds preferentially in open sites (rocky soils and open ground with little woody vegetation or grass cover)
So percentage of immigration of seeds differed between microhabitats following the differential contribution of frugivores to each microhabitat, likely influencing their survival success.
By using plant genetics, this study shows that both components of the seed dispersal kernel have a strong influence on different sides of the seed dispersal curve, therefore, neglecting either component of the seed dispersal kernel based on their removal rates would bias the seed dispersal curve estimated.
Photo credits: K. Zyskowski & Y. Bereshpolova, H vargas, Andy Manning and Vesa Lihavainen.
April 25, 2019
Today we will talk about the future of plant genetics. A recent review suggests microsatellites are an analysis of the past (Flanagan & Jones, 2018), that SNPs are the new microsatellites.
What are microsatellites and what are SNPs?
Microsatellites are short repeat sequences, part of the DNA composed of a sequence with repeated bases. These repeats can be two bases that repeat (ACACACAC), or three, or four (ACGTACGTACGTACGT) and are randomly located throughout the genome. These repeat sequences mutate easily throughout generations, therefore they are a source of genetic polymorphisms within populations.
SNPs instead (pronounced SNIPS) are single nucleotide polymorphisms, so throughout the genome there are these replacements of one single base. For example, instead of ACGT you’d have in some individuals ATGT. These are also a source of polymorphisms within the population, and as such can be used to determine relatedness between individuals. Flanagan & Jones suggest these are the future. Because:
Downsides of Microsatellites:
- Initially developed for fishes, and have actually little polymorphism rate in many species.
- Require a large initial investment to identify loci, designing primers and optimizing PCR (All ailments I went through during my PhD)
- Scoring microsatellites can be ambiguous
- Significant investment in terms of labor and financial resources for genotyping
Advantages of SNPs:
- Higher polymorphism
- Easier automation and scoring
- Low mutation rate, so more stability throughout generations
Flanagan and Jones review all the papers that have used SNPs for parentage analysis, many of such papers comparing the use of SNPs vs. Microsatellites and showing SNPs are entirely appropriate for such analysis.
The authors don’t specifically speak about plant parentage analysis but one of the papers they review and many others on the general literature show SNP analyses work in plants too. In fact, plant breeders have been using them for a while apparently.
Once you use SNPs for parentage analysis, since the basis behind plant spatial genetics is scoring relatedness between individuals, you should also be able to use it for intra- and inter-population spatial genetic structure as well, but nobody has done this yet.
The article describes in detail all the different ways of determining parentage analysis and their pitfalls, how to choose a marker, the software and so on, so it is definitely a good read if interested in using such method yourself.
April 27, 2019
Speaking about methods, today we will talk about software that will come in useful if you want to use plant genetics to support your projects on seed dispersal.
There are several software available for each method, here are the ones I’ve used while dealing with plant spatial genetics with a link to the scientific article describing them:
1: GenAlEx – Different software use different input files, use GenAlEx to convert your genotype file into the input file for the software of your choice. However, this software can also be used to match genotypes from seed coats to mothers, calculate genetic diversity and allelic variance, estimate genetic differentiation between populations, do mantel correlations, calculate pairwise genetic and geographic distance and much more. https://www.ncbi.nlm.nih.gov/pmc/articles/PMC3463245/
2: SpaGeDi – If you want to do spatial genetic structure analysis, this is the one. Very simple MS-DOS, you get your converted input file from GenAlEx in the text form add to it whether you want defined distance classes or just a number of distance classes with equal number of pairs inside and save it. Drag the .txt file in the MS-DOS window, choose which coefficient to use, whether you want to jackknife loci for an error rate, how many permutations for determining the confidence intervals and the format of your output. Seconds later you get an output file which you read with excel and can use to calculate the Sp value, and build the spatial autocorrelogram. https://www2.ulb.ac.be/…/la…/fichiers/manual_SPAGeDi_1-1.pdf
3: CERVUS – Use this for parentage analysis you have to use two files one for potential offspring and one for potential parents. You will have to define the percentage of sampled parents, the genotyping error rate and which likelihood method you want. You will get all the potential parents with their own likelihood estimate. If you want to know parent pairs, you select the parents based on the TRIO LOD score, not each parent’s likelihood score, I had to email the developer to figure this one out. https://www.ncbi.nlm.nih.gov/pubmed/17305863
4: COLONY – This one you’d use to determine sibling relationships, also just parents but CERVUS is faster for parents. COLONY instead can be used, for example, to determine the number and location of maternal sources for seeds collected from seed traps/under sleeping trees, or for estimating the extent of seed shadows by finding maternal siblings. COLONY is very very straight forward to use with a user-friendly interface, it’s just very slow if you select the most statistically powerful options, so start with the fast analysis if you want to just try it out. https://www.ncbi.nlm.nih.gov/pubmed/21565056
5: STRUCTURE - Use this to assess patterns of genetic structure, especially at large scales, for example, when comparing populations. It detects differences in allele frequencies and puts individuals into a number of K clusters, then you use this to determine whether the populations are composed of different clusters or not. It has a very graphical output which you can then plot on a map using GIS. I loved it when I used it, but I didn’t include the results in my thesis. I used it coupled with CLUMPAK to select which was the most feasible number of K clusters from the several options given by the output of STRUCTURE. Here is a nice paper describing the use of STRUCTURE and the coupled software. https://www.ncbi.nlm.nih.gov/pmc/articles/PMC3665925/
This are the ones I’ve personally used, of course there are many others and the choice should be specific to your project’s needs.
April 29, 2019 ===========
This is our last post of the month on plant genetics, we’ll take it to make a summary of what we’ve seen this month and discuss why studying plant genetics is important.
This month, we introduced landscape genetics, the different methods within and how these can be used to understand further seed dispersal by frugivores.
We talked about genetic vs geographic distance correlations (i.e. spatial genetic structure) which can be analyzed between populations, within populations, and even within seed accumulations, to understand gene flow restriction, and seed dispersal patterns.
We saw how through these methods it’s been uncovered that not every accumulation beneath each fruiting tree is composed of undispersed trees, and not every accumulation away from fruiting trees is composed of unrelated seeds. This will strictly depend on frugivore behavior before and after feeding.
Then we talked about Bayesian models overlaid to maps, clustering genetic information into groups, and determining similarity between populations, to understand seed migration and long distance seed dispersal rates.
Finally, we talked about parentage analysis, how it can be done with seed coats to reveal maternal sources, or with seedlings to reveal maternal and parental sources. This can be used to determine seed dispersal distance, seed shadow extent of a determined individual, number of maternal sources within seed accumulations and even to compare effective seed dispersal distance vs basic seed dispersal distance.
We also saw what the future holds for plant genetics, that we should all start thinking about SNPs instead of microsatellites or AFLPs (AFLPs were already old school by the way), and we finished with a short introduction to the most used software for plant spatial genetics.
We didn’t talk about why understanding gene flow is important. So, if you are still skeptical plant genetics is worth your time, the ultimate reason is that you can understand the long-term consequences of your seed dispersal system.
If your seed dispersal system, perhaps because it is fragmented or because it has been defaunated, is restricting gene flow (i.e. you see strong spatial genetic structure, no seed migration, short dispersal distance) this can lead to inbreeding within populations, losing genetic diversity, reducing the population’s fitness, and increasing the extinction risk of the population in case of adverse events (i.e. climate change). An important link between conservation, frugivores and seed dispersal.
Gene flow has also been considered an important evolutionary force, but for that regard, I invite you to read https://bsapubs.onlinelibrary.wiley.com/…/10.37…/ajb.1400024

.jpg)
.jpg)
